Australian Politics Forum
http://www.ozpolitic.com/forum/YaBB.pl
Member Run Boards >> Environment >> Temperature data manipulation exposed
http://www.ozpolitic.com/forum/YaBB.pl?num=1344392462

Message started by progressiveslol on Aug 8th, 2012 at 12:21pm

Title: Temperature data manipulation exposed
Post by progressiveslol on Aug 8th, 2012 at 12:21pm
This needs its own thread to track what is going on with temp data manipulation. An new area of climate change statistics that is relied upon but not well known(to the layperson) or investigated(scientifically). WUWT, stevengoddard and others are trying to get it right.

I will start with this gem, just to give you an idea of how bad the manipulation is.


USHCN makes a huge TOBS adjustment in Ohio between 1979 and 1988, as seen below


The justification for this is that they claim people in Ohio switched from reading temperatures in the afternoon, to reading them in the morning. That would theoretically push measured temperatures progressively down from 1979 to 1988.

The Ohio raw data does not provide any support for the TOBS theory.  In the middle of a long term cooling trend, measured temperatures rose very quickly from 1979 to 1988  - shown in red below. In fact, the thermometers reported the steepest temperature rise in Ohio history.


But it gets worse. The final adjustments are almost three degrees


By the time USHCN is done adjusting, they have created a warming trend – which 127 years of Ohio thermometers never saw.


http://stevengoddard.wordpress.com/2012/08/08/ushcn-madness-in-ohio/

Title: Re: Temperature data manipulation exposed
Post by Upton Sinclair on Aug 8th, 2012 at 1:11pm
Exposed! By a blogger. Top work, Encyclopedia Brown, you've busted yet another conspiracy!

Steve Goddard is such a loon that even Anthony Watts won't let him publish on WUWT any more. But, of course, you uncritically accept every word he utter because, after all, you're a SCEPTIC! ;D

Title: Re: Temperature data manipulation exposed
Post by MOTR on Aug 8th, 2012 at 2:05pm
Are you looking for a job at the Telegraph, progs. I'm sure Murdoch could use a man of your particular talents.

Title: Re: Temperature data manipulation exposed
Post by muso on Aug 8th, 2012 at 3:08pm

progressiveslol wrote on Aug 8th, 2012 at 12:21pm:
This needs its own thread to track what is going on with temp data manipulation. An new area of climate change statistics that is relied upon but not well known(to the layperson) or investigated(scientifically). WUWT, stevengoddard and others are trying to get it right.


- and here was I thinking that Anthony Watts was a layperson. Silly me.

Title: Re: Temperature data manipulation exposed
Post by progressiveslol on Aug 8th, 2012 at 3:34pm
I see by all the comments about the data  ::) that everyone wants more. Please be patient as I have other duties to attend to.

Title: Re: Temperature data manipulation exposed
Post by progressiveslol on Aug 8th, 2012 at 11:49pm
This is extreme man-made global warming in action in New Zealand.


This is what the thermometers recorded from 1850 – 2000.


Here another version of those thermometers after adjustments.

This is what man-made global warming looks like.


The entire NZ record was based on adjustments described in an  annex in James Salinger’s 1981 thesis. When the skeptics asked for information on the adjustments they became very difficult to find. After years of searching, NIWA finally admitted the statistical calculations were entirely lost. [See “New Zealand – Unaffected by Global Warming”]

Faced with such an inexplicable, hard-to-believe record, the logical next step was to get justice. (If only that were easy). Read on for a brief summary of the High Court action and the latest news.

http://joannenova.com.au/2012/08/dont-mention-the-peer-review-new-zealands-niwa-bury-the-australian-review/

Title: Re: Temperature data manipulation exposed
Post by progressiveslol on Aug 9th, 2012 at 12:14am
Other manipulations

http://icecap.us/images/uploads/NOAAroleinclimategate.pdf

Title: Re: Temperature data manipulation exposed
Post by progressiveslol on Aug 9th, 2012 at 7:28am
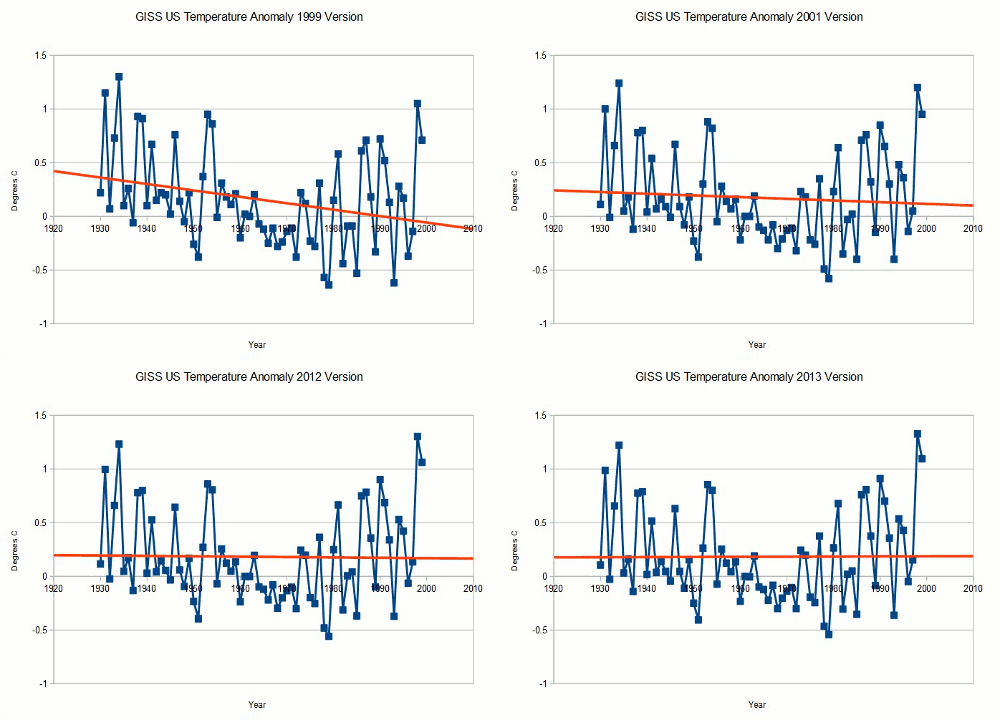
For historical reference to GISS temp manipulation - hansen


Then within 2 years, 1934 and 1998 were virtualy the same


Then there is the Arctic temps

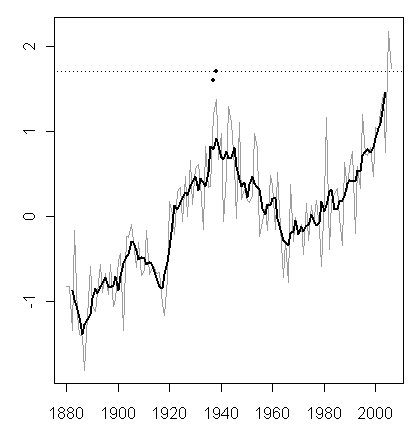
Changes in the relationship of the 1930s to recent values have not merely been made in the United States. In the Arctic, there has also been a progressive change in the relationship of temperatures in the 1930s to recent temperatures, a point previously discussed at CA here . Hansen and Lebedeff 1987 showed very warm 1930s in the Arctic, as shown in the excerpted figure showing the 64-90N temperature history.


Excerpt from Hansen and Lebedeff 1987, showing 64-90N temperature. The horizontal plot is from 1880 to 1985 (as seen in the full Figure 7 of the original article shown here )

The graphic below compares the most recent version of the same graph (plotted from online data at GISS), marking two bold points for 1937 and 1938 obtained from the printed information in Hansen and Lebedeff 1987 (which prints out the data now shown online). For both 1937 and 1938, the GISS estimates have been reduced by approximately 0.4 deg C. Despite recent warming, 2005 was the first year in which 64-90N values exceeded the former 1938 value – see dotted line – (indeed, 2003 was the first year that exceeded the “adjusted” 1938 value). While there are undoubtedly “good” reasons for these adjustments (and I am not here arguing the point one way or the other), the net effect of the adjustments has been to consistently lower temperatures in the 1930s relative to more recent values. Whether these adjustments prove justified or not, modifications to the temperature record of this magnitude surely warrant the most careful scrutiny before turning the “lights out upstairs.”


64-90N from Hansen 64-90N zone downloaded today. Thick – 5 year running mean (often used by Hansen). Points are selected values from Hansen and Lebedeff 1987. Dotted line compares 1938 value from Hansen and Lebedeff 1987 to other values

http://climateaudit.org/2007/08/11/lights-out-upstairs/

a full writeup can be found here
http://wattsupwiththat.com/2012/08/08/dear-noaa-and-seth-which-1930s-were-you-referring-to-when-you-say-july-is-the-record-warmest/

Title: Re: Temperature data manipulation exposed
Post by progressiveslol on Aug 9th, 2012 at 7:43am
The Man Made Hockey Stick

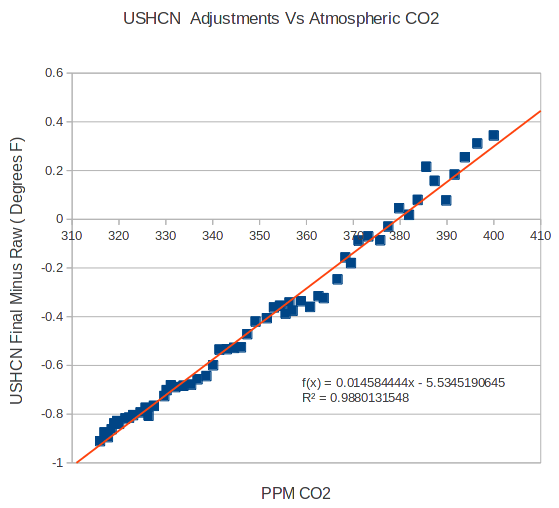
The graph below shows the almost two degree US upwards adjustment trend being applied by USHCN between the raw thermometer data and the published monthly data.


The adjustments they are making are greater than the claimed trend, meaning that all man made US warming is occurring inside ORNL and GISS computers.

There is no legitimate physical explanation would would explain such a regular trend in temperature bias – other than UHI, which has the opposite polarity.

In their literature, they document 0.5F worth of adjustments, not 1.8F . They are delivering data with more than 300% of the adjustments described in Menne et al.


http://stevengoddard.wordpress.com/2012/08/07/the-man-made-hockey-stick/

Title: Re: Temperature data manipulation exposed
Post by MOTR on Aug 9th, 2012 at 11:22am
Can you refer us to any peer reviewed papers, progs.

At the moment all you are doing is regurgitating noise from discredited sources. If there was substance to any of these claims why arent we seeing papers published on this problem. Can you point me to the soure of Goddard's data? Has he used the same technique to analyse data outside of Oklahoma. How about you use your skeptical powers on Goddard?

Title: Re: Temperature data manipulation exposed
Post by Upton Sinclair on Aug 9th, 2012 at 12:38pm

MOTR wrote on Aug 9th, 2012 at 11:22am:
Can you refer us to any peer reviewed papers, progs.

At the moment all you are doing is regurgitating noise from discredited sources. If there was substance to any of these claims why arent we seeing papers published on this problem. Can you point me to the soure of Goddard's data? Has he used the same technique to analyse data outside of Oklahoma. How about you use your skeptical powers on Goddard?


No, no! You don't get it MOTR. This is a new ERA of climate statistics. The era of peer2peer review! ;D

Title: Re: Temperature data manipulation exposed
Post by progressiveslol on Aug 9th, 2012 at 12:45pm

Upton Sinclair wrote on Aug 9th, 2012 at 12:38pm:

MOTR wrote on Aug 9th, 2012 at 11:22am:
Can you refer us to any peer reviewed papers, progs.

At the moment all you are doing is regurgitating noise from discredited sources. If there was substance to any of these claims why arent we seeing papers published on this problem. Can you point me to the soure of Goddard's data? Has he used the same technique to analyse data outside of Oklahoma. How about you use your skeptical powers on Goddard?


No, no! You don't get it MOTR. This is a new ERA of climate statistics. The era of peer2peer review! ;D

As opposed to the still current pal-review process.

Title: Re: Temperature data manipulation exposed
Post by progressiveslol on Aug 9th, 2012 at 12:46pm

MOTR wrote on Aug 9th, 2012 at 11:22am:
Can you refer us to any peer reviewed papers, progs.

At the moment all you are doing is regurgitating noise from discredited sources. If there was substance to any of these claims why arent we seeing papers published on this problem. Can you point me to the soure of Goddard's data? Has he used the same technique to analyse data outside of Oklahoma. How about you use your skeptical powers on Goddard?

Regardless of what you think of the noise, it is a squeaky wheel and it will get the obvious fraud or poor homogenisation fixed.

Title: Re: Temperature data manipulation exposed
Post by progressiveslol on Aug 17th, 2012 at 4:27pm
Blog Memo to James Hansen Regarding GISS Southern Hemisphere Land Surface Temperature Data

James, you should look into this matter. I don’t have the time or the inclination to carry this investigation any further.

Some persons might think GISS has been manipulating data to acquire a higher land surface temperature anomaly trend in recent years.  They also might assume GISS has been reducing coverage in recent years to create a little more variability, thereby increasing the chances for new record temperatures with each El Niño. And the way that all suppliers of temperature data appear to use data for a grid one year but not the next, and then have data for that grid reappear a year or two later,  may lead some persons to think data is being cherry picked for use. We wouldn’t want people to think those things.

Final note: As you know, GISS, in effect, deletes sea surface temperature data in areas of seasonal sea ice and replaces it with much-more-variable land surface temperature data. This, of course, creates a warming bias at the poles in the GISS data. Refer to the zonal-mean graph in Figure 11 that compares the linear trends of the Reynolds OI.v2 data and the version of it with the GISS modifications, for the period of January 1982 to October 2011. It’s from my most recent post that discusses this subject: The Impact of GISS Replacing Sea Surface Temperature Data With Land Surface Temperature Data.

Because of that monumental bias, when I present GISS Land-Ocean Temperature Index data, I usually limit the latitudes to exclude polar data. Now, with this find in your land surface temperature data, I’ve had to switch to an average of the GHCN and CRUTEM3 data for that chapter of Who Turned on the Heat? The Unsuspected Global Warming Culprit, El Niño-Southern Oscillation.Sorry to say, but with all of the biases toward warming, your GISS LOTI data, in my eyes, is becoming more and more unsuitable for research.


much more
http://wattsupwiththat.com/2012/08/16/blog-memo-to-james-hansen-regarding-giss-southern-hemisphere-land-surface-temperature-data/

Title: Re: Temperature data manipulation exposed
Post by Deathridesahorse on Aug 17th, 2012 at 6:04pm
DOCUMENT SHOCK: THE SHYSTERS WEAPON OF CHOICE!

Title: Re: Temperature data manipulation exposed
Post by progressiveslol on Aug 20th, 2012 at 8:28am
July was also the 329th consecutive month of positive upwards adjustment to the U.S. temperature record by NOAA/NCDC

I’ve noticed there’s a lot of frenetic tweeting and re-tweeting of this “sound bite” sized statement from this Climate Central piece by Andrew Freedman.


July was the fourth-warmest such month on record globally, and the 329th consecutive month with a global-average surface temperature above the 20th-century average, according to an analysis released Wednesday by the National Climatic Data Center (NCDC).

It should be noted that Climate Central is funded for the sole purpose of spreading worrisome climate missives. Yes it was a hot July in the USA too, approximately as hot as July 1936 comparing within he USHCN, No debate there. It is also possibly slightly cooler if you compare to the new state of the art Climate Reference Network.

But, those comparisons aside, here’s what Climate Central’s Andrew Freedman and NOAA/NCDC won’t show you when discussing the surface temperature record:


It isn’t hard to stay above the average temperature value when your adjustments outpace the temperature itself. There’s about 0.45°C of temperature rise in the adjustments since about 1940.

Since I know some people (and you know who you are) won’t believe the graph above created by taking the final adjusted USHCN data used for public statements and subtracting the raw data straight from the weather station observers to show the magnitude of adjustments. So, I’ll put up the NCDC graph, that they provided here:

http://www.ncdc.noaa.gov/img/climate/research/ushcn/ts.ushcn_anom25_diffs_urb-raw_pg.gif

But they no longer update it, nor provide an equivalent for USHCN2 (as shown above), because well, it just doesn’t look so good.


As discussed in: Warming in the USHCN is mainly an artifact of adjustments on April,13th of this year, this graph shows that when you compare the US surface temperature record to an hourly dataset (ISH ) that doesn’t require a cartload of adjustments in the first place, and applies a population growth factor (as a proxy for UHI) all of the sudden, the trend doesn’t look so hot. The graph was prepared by Dr. Roy Spencer.

http://wattsupwiththat.files.wordpress.com/2012/08/ushcn-vs-crutem3-ishpdat.png
GRAPH BELOW

There’s quite an offset in 2012, about 0.7°C between Dr. Spencer’s ISH PDAT and USHCN/CRU. It should be noted that CRU uses the USHCN data in their data, so it isn’t any surprise to find no divergence between those.

Similar, but not all, of the adjustments are applied to the GHCN, used to derive the global surface temperature average. That data is also managed by NCDC.

Now of course many will argue that the adjustments are necessary to correct the data, which has all sorts of problems with inhomogenity, time of observation, siting, missing data, etc. But, none of that negates this statement:  July was also the 329th consecutive month of positive upwards adjustment to the U.S. temperature record by NOAA/NCDC

In fact, since the positive adjustments clearly go back to about 1940, it would be accurate to say that: July was also the 864th consecutive month of positive upwards adjustment to the U.S. temperature record by NOAA/NCDC.

Dr Spencer concluded in his essay Warming in the USHCN is mainly an artifact of adjustments :


And I must admit that those adjustments constituting virtually all of the warming signal in the last 40 years is disconcerting. When “global warming” only shows up after the data are adjusted, one can understand why so many people are suspicious of the adjustments.

To counter all the Twitter madness out there over that “329th consecutive month of above normal temperature”, I suggest that WUWT readers tweet back to the same people that it is also the 329th or 864th consecutive month (your choice) of upwards adjustments to the U.S. temperature record.

Here’s the shortlink to make it easy for you:

http://wp.me/p7y4l-i66


http://wattsupwiththat.com/2012/08/19/july-was-also-the-329th-consecutive-month-of-positive-upwards-adjustment-to-the-u-s-temperature-record-by-noaancdc

Title: Re: Temperature data manipulation exposed
Post by MOTR on Aug 20th, 2012 at 9:20am
It would seem to me that if a cooling bias existed in the past, which seems to be universally accepted, current temperatures would need to be adjusted upwards to maintain relativity. Without these adjustments historical comparisons would be useless or purposely misleading. The consecutive number of months adjusted upwards is a red herring.

Watch the author of this propaganda piece give themselves up.


Quote:
Now of course many will argue that the adjustments are necessary to correct the data, which has all sorts of problems with inhomogenity, time of observation, siting, missing data, etc. But, none of that negates this statement:  July was also the 329th consecutive month of positive upwards adjustment to the U.S. temperature record by NOAA/NCDC


So the question remains is there a legitimate need for these adjustments. Now until you can refer me to a peer review paper that deals specifically with these adjustments, pointing to the consecutive number of months is just foolish.

Title: Re: Temperature data manipulation exposed
Post by Chrislee on Aug 27th, 2012 at 7:30pm
Nice graph you show here.

Title: Re: Temperature data manipulation exposed
Post by namnugenot on Aug 28th, 2012 at 6:00pm

MOTR wrote on Aug 20th, 2012 at 9:20am:
It would seem to me that if a cooling bias existed in the past, which seems to be universally accepted, current temperatures would need to be adjusted upwards to maintain relativity. Without these adjustments historical comparisons would be useless or purposely misleading. The consecutive number of months adjusted upwards is a red herring.

Watch the author of this propaganda piece give themselves up.


Quote:
Now of course many will argue that the adjustments are necessary to correct the data, which has all sorts of problems with inhomogenity, time of observation, siting, missing data, etc. But, none of that negates this statement:  July was also the 329th consecutive month of positive upwards adjustment to the U.S. temperature record by NOAA/NCDC


So the question remains is there a legitimate need for these adjustments. Now until you can refer me to a peer review paper that deals specifically with these adjustments, pointing to the consecutive number of months is just foolish.


Foolish huh...you might go and have a look at the emails hacked in 2009...very interesting reading. 
"It was announced Thursday afternoon that computer hackers had obtained 160 megabytes of e-mails from the Climate Research Unit (CRU) at the University of East Anglia (UEA) in England. Those e-mails involved communication among many scientific researchers and policy advocates with similar ideological positions all across the world. Those purported authorities were brazenly discussing the destruction and hiding of data that did not support global-warming claims."
So in what category is systematic destruction and concealment of data fit into...do these also count as adjustments?
You see the simple fact is that if you treat data in such a fashion to conform to a predetermined finding, it's not called adjustment...it's called fraud. So how can there be proper peer review where data is controlled/deleted/hidden to facilitate a finding not otherwise supported.

Title: Re: Temperature data manipulation exposed
Post by rabbitoh07 on Aug 28th, 2012 at 6:20pm

progressiveslol wrote on Aug 8th, 2012 at 12:21pm:
This needs its own thread to track what is going on with temp data manipulation. An new area of climate change statistics that is relied upon but not well known(to the layperson) or investigated(scientifically). WUWT, stevengoddard and others are trying to get it right.

I will start with this gem, just to give you an idea of how bad the manipulation is.


USHCN makes a huge TOBS adjustment in Ohio between 1979 and 1988, as seen below


The justification for this is that they claim people in Ohio switched from reading temperatures in the afternoon, to reading them in the morning. That would theoretically push measured temperatures progressively down from 1979 to 1988.

The Ohio raw data does not provide any support for the TOBS theory.  In the middle of a long term cooling trend, measured temperatures rose very quickly from 1979 to 1988  - shown in red below. In fact, the thermometers reported the steepest temperature rise in Ohio history.


But it gets worse. The final adjustments are almost three degrees


By the time USHCN is done adjusting, they have created a warming trend – which 127 years of Ohio thermometers never saw.


http://stevengoddard.wordpress.com/2012/08/08/ushcn-madness-in-ohio/

Yeah...right.

Meanwhile, on Planet Earth:

'Arctic sea ice shrinks to lowest extent ever recorded on August 26

http://timesofindia.indiatimes.com/home/environment/global-warming/Arctic-sea-ice-shrinks-to-lowest-extent-ever-recorded-on-August-26/articleshow/15880401.cms

Title: Re: Temperature data manipulation exposed
Post by progressiveslol on Aug 28th, 2012 at 8:39pm

rabbitoh07 wrote on Aug 28th, 2012 at 6:20pm:

progressiveslol wrote on Aug 8th, 2012 at 12:21pm:
This needs its own thread to track what is going on with temp data manipulation. An new area of climate change statistics that is relied upon but not well known(to the layperson) or investigated(scientifically). WUWT, stevengoddard and others are trying to get it right.

I will start with this gem, just to give you an idea of how bad the manipulation is.


USHCN makes a huge TOBS adjustment in Ohio between 1979 and 1988, as seen below


The justification for this is that they claim people in Ohio switched from reading temperatures in the afternoon, to reading them in the morning. That would theoretically push measured temperatures progressively down from 1979 to 1988.

The Ohio raw data does not provide any support for the TOBS theory.  In the middle of a long term cooling trend, measured temperatures rose very quickly from 1979 to 1988  - shown in red below. In fact, the thermometers reported the steepest temperature rise in Ohio history.


But it gets worse. The final adjustments are almost three degrees


By the time USHCN is done adjusting, they have created a warming trend – which 127 years of Ohio thermometers never saw.


http://stevengoddard.wordpress.com/2012/08/08/ushcn-madness-in-ohio/

Yeah...right.

Meanwhile, on Planet Earth:

'Arctic sea ice shrinks to lowest extent ever recorded on August 26

http://timesofindia.indiatimes.com/home/environment/global-warming/Arctic-sea-ice-shrinks-to-lowest-extent-ever-recorded-on-August-26/articleshow/15880401.cms

Not according to IMS


Title: Re: Temperature data manipulation exposed
Post by MOTR on Aug 28th, 2012 at 8:53pm
So now you want to talk about total ice. Is that right, progs? It doesn't matter how you measure it, the earth is warming and the Arctic is melting.

Title: Re: Temperature data manipulation exposed
Post by progressiveslol on Aug 28th, 2012 at 8:55pm

MOTR wrote on Aug 28th, 2012 at 8:53pm:
So now you want to talk about ice volume. Is that right, progs? It doesn't matter how you measure it, the Arctic is melting.

Hate to break it to you but it melts every year.

Title: Re: Temperature data manipulation exposed
Post by MOTR on Aug 28th, 2012 at 8:58pm

progressiveslol wrote on Aug 28th, 2012 at 8:55pm:

MOTR wrote on Aug 28th, 2012 at 8:53pm:
So now you want to talk about ice volume. Is that right, progs? It doesn't matter how you measure it, the Arctic is melting.

Hate to break it to you but it melts every year.


No s#it, Sherlock. Who do you think is going to fall for that sort of logic?

Grow up, sunshine.

Title: Re: Temperature data manipulation exposed
Post by progressiveslol on Aug 28th, 2012 at 9:01pm

MOTR wrote on Aug 28th, 2012 at 8:58pm:

progressiveslol wrote on Aug 28th, 2012 at 8:55pm:

MOTR wrote on Aug 28th, 2012 at 8:53pm:
So now you want to talk about ice volume. Is that right, progs? It doesn't matter how you measure it, the Arctic is melting.

Hate to break it to you but it melts every year.


No s#it, Sherlock. Who do you think is going to fall for that sort of logic?

Grow up, sunshine.

It needed to be said off the back of your statement It doesn't matter how you measure it, the Arctic is melting

Title: Re: Temperature data manipulation exposed
Post by rabbitoh07 on Aug 28th, 2012 at 9:04pm

progressiveslol wrote on Aug 28th, 2012 at 8:39pm:

rabbitoh07 wrote on Aug 28th, 2012 at 6:20pm:

progressiveslol wrote on Aug 8th, 2012 at 12:21pm:
This needs its own thread to track what is going on with temp data manipulation. An new area of climate change statistics that is relied upon but not well known(to the layperson) or investigated(scientifically). WUWT, stevengoddard and others are trying to get it right.

I will start with this gem, just to give you an idea of how bad the manipulation is.


USHCN makes a huge TOBS adjustment in Ohio between 1979 and 1988, as seen below


The justification for this is that they claim people in Ohio switched from reading temperatures in the afternoon, to reading them in the morning. That would theoretically push measured temperatures progressively down from 1979 to 1988.

The Ohio raw data does not provide any support for the TOBS theory.  In the middle of a long term cooling trend, measured temperatures rose very quickly from 1979 to 1988  - shown in red below. In fact, the thermometers reported the steepest temperature rise in Ohio history.


But it gets worse. The final adjustments are almost three degrees


By the time USHCN is done adjusting, they have created a warming trend – which 127 years of Ohio thermometers never saw.


http://stevengoddard.wordpress.com/2012/08/08/ushcn-madness-in-ohio/

Yeah...right.

Meanwhile, on Planet Earth:

'Arctic sea ice shrinks to lowest extent ever recorded on August 26

http://timesofindia.indiatimes.com/home/environment/global-warming/Arctic-sea-ice-shrinks-to-lowest-extent-ever-recorded-on-August-26/articleshow/15880401.cms

Not according to IMS

errrr....both of those graphs show 2012 at unprecidented lows for the equivalent time of year.

And - as you have already been told - Arctic sea ice it at its lowest level ever measured.

Still in denial?

Title: Re: Temperature data manipulation exposed
Post by rabbitoh07 on Aug 28th, 2012 at 9:06pm

progressiveslol wrote on Aug 20th, 2012 at 8:28am:
July was also the 329th consecutive month of positive upwards adjustment to the U.S. temperature record by NOAA/NCDCblah...blah...blah...

So why is the Arctic melting?

Should we blame the Carbon Tax?

Title: Re: Temperature data manipulation exposed
Post by MOTR on Aug 28th, 2012 at 9:07pm
Or urban heat islands?

Title: Re: Temperature data manipulation exposed
Post by progressiveslol on Aug 28th, 2012 at 9:08pm

rabbitoh07 wrote on Aug 28th, 2012 at 9:04pm:

progressiveslol wrote on Aug 28th, 2012 at 8:39pm:

rabbitoh07 wrote on Aug 28th, 2012 at 6:20pm:

progressiveslol wrote on Aug 8th, 2012 at 12:21pm:
This needs its own thread to track what is going on with temp data manipulation. An new area of climate change statistics that is relied upon but not well known(to the layperson) or investigated(scientifically). WUWT, stevengoddard and others are trying to get it right.

I will start with this gem, just to give you an idea of how bad the manipulation is.


USHCN makes a huge TOBS adjustment in Ohio between 1979 and 1988, as seen below


The justification for this is that they claim people in Ohio switched from reading temperatures in the afternoon, to reading them in the morning. That would theoretically push measured temperatures progressively down from 1979 to 1988.

The Ohio raw data does not provide any support for the TOBS theory.  In the middle of a long term cooling trend, measured temperatures rose very quickly from 1979 to 1988  - shown in red below. In fact, the thermometers reported the steepest temperature rise in Ohio history.


But it gets worse. The final adjustments are almost three degrees


By the time USHCN is done adjusting, they have created a warming trend – which 127 years of Ohio thermometers never saw.


http://stevengoddard.wordpress.com/2012/08/08/ushcn-madness-in-ohio/

Yeah...right.

Meanwhile, on Planet Earth:

'Arctic sea ice shrinks to lowest extent ever recorded on August 26

http://timesofindia.indiatimes.com/home/environment/global-warming/Arctic-sea-ice-shrinks-to-lowest-extent-ever-recorded-on-August-26/articleshow/15880401.cms

Not according to IMS

errrr....both of those graphs show 2012 at unprecidented lows for the equivalent time of year.

And - as you have already been told - Arctic sea ice it at its lowest level ever measured.

Still in denial?

I dont see on these 2 graphs where it is at its lowest. It lowest is not until the end of the melt season.


Title: Re: Temperature data manipulation exposed
Post by progressiveslol on Aug 28th, 2012 at 9:09pm

rabbitoh07 wrote on Aug 28th, 2012 at 9:06pm:

progressiveslol wrote on Aug 20th, 2012 at 8:28am:
July was also the 329th consecutive month of positive upwards adjustment to the U.S. temperature record by NOAA/NCDCblah...blah...blah...

So why is the Arctic melting?

Should we blame the Carbon Tax?

Summer. It happens every year.

Title: Re: Temperature data manipulation exposed
Post by rabbitoh07 on Aug 28th, 2012 at 9:14pm

progressiveslol wrote on Aug 28th, 2012 at 9:09pm:

rabbitoh07 wrote on Aug 28th, 2012 at 9:06pm:

progressiveslol wrote on Aug 20th, 2012 at 8:28am:
July was also the 329th consecutive month of positive upwards adjustment to the U.S. temperature record by NOAA/NCDCblah...blah...blah...

So why is the Arctic melting?

Should we blame the Carbon Tax?

Summer. It happens every year.

So why has it melted more this summer than any time in recorded history?

Why was the summer Arctic melting more during the first decade of the 2000s than any time in previous recoded history?

Why was the summer Arctic melting more during the 1990s than any time in previous recoded history?

Why was the summer Arctic melting more during the 1980s than any time in previous recoded history?

Can you see a pattern here?

Can you explain it?

Can you explain it in a way that demonstrates that virtually every scientist on the planet's explanation for it is wrong?


Title: Re: Temperature data manipulation exposed
Post by progressiveslol on Aug 28th, 2012 at 9:22pm

rabbitoh07 wrote on Aug 28th, 2012 at 9:14pm:

progressiveslol wrote on Aug 28th, 2012 at 9:09pm:

rabbitoh07 wrote on Aug 28th, 2012 at 9:06pm:

progressiveslol wrote on Aug 20th, 2012 at 8:28am:
July was also the 329th consecutive month of positive upwards adjustment to the U.S. temperature record by NOAA/NCDCblah...blah...blah...

So why is the Arctic melting?

Should we blame the Carbon Tax?

Summer. It happens every year.

So why has it melted more this summer than any time in recorded history?

Why was the summer Arctic melting more during the first decade of the 2000s than any time in previous recoded history?

Why was the summer Arctic melting more during the 1990s than any time in previous recoded history?

Why was the summer Arctic melting more during the 1980s than any time in previous recoded history?

Can you see a pattern here?

Can you explain it?

Can you explain it in a way that demonstrates that virtually every scientist on the planet's explanation for it is wrong?


jestreams further north and a major storm low pressure cell breaking up the ice recently. Not sure who to believe though on the graphs. Mine shows no big deal yet, the other shows a pretty major melt.

Title: Re: Temperature data manipulation exposed
Post by namnugenot on Aug 29th, 2012 at 9:47am

rabbitoh07 wrote on Aug 28th, 2012 at 9:14pm:

progressiveslol wrote on Aug 28th, 2012 at 9:09pm:

rabbitoh07 wrote on Aug 28th, 2012 at 9:06pm:

progressiveslol wrote on Aug 20th, 2012 at 8:28am:
July was also the 329th consecutive month of positive upwards adjustment to the U.S. temperature record by NOAA/NCDCblah...blah...blah...

So why is the Arctic melting?

Should we blame the Carbon Tax?

Summer. It happens every year.

So why has it melted more this summer than any time in recorded history?

Why was the summer Arctic melting more during the first decade of the 2000s than any time in previous recoded history?

Why was the summer Arctic melting more during the 1990s than any time in previous recoded history?

Why was the summer Arctic melting more during the 1980s than any time in previous recoded history?

Can you see a pattern here?

Can you explain it?

Can you explain it in a way that demonstrates that virtually every scientist on the planet's explanation for it is wrong?


Why was it sunny and hot yesterday and raining and cold today?

When you talk about "anytime in previous recorded history" your really only talking about a couple of decades at most of recording on a scale that gives you an idea of the total mass of ice. So really a minute time-frame in the scheme of things and tells you little of what the actual true variabilty is. Also during this time you have increases in the number of measurements taken, how those measurements are taken and the equipment used to take those measurements. This excludes any climatic variability. So you should have much better or more accurate data, barring manipulation as evidenced by the climategate emails. Earlier measurements would have large margins of error and later would have smaller margins of error of the extent and total of ice only...not to actual total mass and extent, so you're not comparing apples with apples. So how much of this shrinkage is to do with the increase in accuracy of the data coupled with natural variability?
As for temperature it would probably be a safe bet that temperature "adjustments" and climate "warming" would be very well correlated.

Title: Re: Temperature data manipulation exposed
Post by rabbitoh07 on Aug 29th, 2012 at 5:55pm

progressiveslol wrote on Aug 28th, 2012 at 9:22pm:

rabbitoh07 wrote on Aug 28th, 2012 at 9:14pm:

progressiveslol wrote on Aug 28th, 2012 at 9:09pm:

rabbitoh07 wrote on Aug 28th, 2012 at 9:06pm:

progressiveslol wrote on Aug 20th, 2012 at 8:28am:
July was also the 329th consecutive month of positive upwards adjustment to the U.S. temperature record by NOAA/NCDCblah...blah...blah...

So why is the Arctic melting?

Should we blame the Carbon Tax?

Summer. It happens every year.

So why has it melted more this summer than any time in recorded history?

Why was the summer Arctic melting more during the first decade of the 2000s than any time in previous recoded history?

Why was the summer Arctic melting more during the 1990s than any time in previous recoded history?

Why was the summer Arctic melting more during the 1980s than any time in previous recoded history?

Can you see a pattern here?

Can you explain it?

Can you explain it in a way that demonstrates that virtually every scientist on the planet's explanation for it is wrong?


jestreams further north and a major storm low pressure cell breaking up the ice recently. Not sure who to believe though on the graphs. Mine shows no big deal yet, the other shows a pretty major melt.

THe graphs you posted were not specific to the Arctic ice cap - yet they did still show that the Total IMS Sea and Lake Ice extent coverage was lower in 2012 than any other year on that graph at mid August.  Entirely consistent with the NSIDC graph

Title: Re: Temperature data manipulation exposed
Post by rabbitoh07 on Aug 29th, 2012 at 5:59pm

namnugenot wrote on Aug 29th, 2012 at 9:47am:

rabbitoh07 wrote on Aug 28th, 2012 at 9:14pm:

progressiveslol wrote on Aug 28th, 2012 at 9:09pm:

rabbitoh07 wrote on Aug 28th, 2012 at 9:06pm:

progressiveslol wrote on Aug 20th, 2012 at 8:28am:
July was also the 329th consecutive month of positive upwards adjustment to the U.S. temperature record by NOAA/NCDCblah...blah...blah...

So why is the Arctic melting?

Should we blame the Carbon Tax?

Summer. It happens every year.

So why has it melted more this summer than any time in recorded history?

Why was the summer Arctic melting more during the first decade of the 2000s than any time in previous recoded history?

Why was the summer Arctic melting more during the 1990s than any time in previous recoded history?

Why was the summer Arctic melting more during the 1980s than any time in previous recoded history?

Can you see a pattern here?

Can you explain it?

Can you explain it in a way that demonstrates that virtually every scientist on the planet's explanation for it is wrong?


Why was it sunny and hot yesterday and raining and cold today?

When you talk about "anytime in previous recorded history" your really only talking about a couple of decades at most of recording on a scale that gives you an idea of the total mass of ice. So really a minute time-frame in the scheme of things and tells you little of what the actual true variabilty is. Also during this time you have increases in the number of measurements taken, how those measurements are taken and the equipment used to take those measurements. This excludes any climatic variability. So you should have much better or more accurate data, barring manipulation as evidenced by the climategate emails. Earlier measurements would have large margins of error and later would have smaller margins of error of the extent and total of ice only...not to actual total mass and extent, so you're not comparing apples with apples. So how much of this shrinkage is to do with the increase in accuracy of the data coupled with natural variability?
As for temperature it would probably be a safe bet that temperature "adjustments" and climate "warming" would be very well correlated.

Are you denying that the summer Arctic melt in 2012 is greater than any time in previous recoded history?

And could you show us this "manipulation as evidenced by the climategate emails"?
Or is your post actually a satirical take on some of the more moronic deniers?  If so - good job.

Title: Re: Temperature data manipulation exposed
Post by MOTR on Sep 1st, 2012 at 4:45am
If it wasn't so serious it would be funny.

http://www.youtube.com/watch?v=ARJK0MWAITM&sns=em

Title: Re: Temperature data manipulation exposed
Post by progressiveslol on May 13th, 2013 at 7:23pm
Thought it about time some more of the climate fraud data be put on here.

Met Office Hadley Centre and Climatic Research Unit HadCRUT4 and CRUTEM4 Temperature Data Sets Adjusted/Corrected/Updated… Can You Guess The Impact?

Cooling the past, warming the present, is all these fraudsters have left with the northern hemisphere cooling.

http://wattsupwiththat.com/2013/05/12/met-office-hadley-centre-and-climatic-research-unit-hadcrut4-and-crutem4-temperature-data-sets-adjustedcorrectedupdated-can-you-guess-the-impact

Title: Re: Temperature data manipulation exposed
Post by muso on Jul 22nd, 2013 at 9:48pm

progressiveslol wrote on May 13th, 2013 at 7:23pm:
Thought it about time some more of the climate fraud data be put on here.

Met Office Hadley Centre and Climatic Research Unit HadCRUT4 and CRUTEM4 Temperature Data Sets Adjusted/Corrected/Updated… Can You Guess The Impact?

Cooling the past, warming the present, is all these fraudsters have left with the northern hemisphere cooling.

http://wattsupwiththat.com/2013/05/12/met-office-hadley-centre-and-climatic-research-unit-hadcrut4-and-crutem4-temperature-data-sets-adjustedcorrectedupdated-can-you-guess-the-impact


Maybe the retired radio presenter (Watt's his name?) is on to something...... nah.

Title: Re: Temperature data manipulation exposed
Post by Ajax on Jul 23rd, 2013 at 2:44pm
You know that these days the amount of thermometers around the world has been reduced by more than half and the ones left are not in open fields.

They tend to be positioned next to HVAC's or airport runways or tarmac and concrete roads and structures.

The 0.5 degree rise in temperature could also be atrributed to this.

The other thing is most of the warming of the last centrury happened before 1940, now isn't that strange because after 1940 mans production of CO2 went up yet temperatures fell until about the nid 1970's.

This scared the very same clowns that are screaming global warming today to scream global cooling back then.

Earth's temperature increases and decreases with the activities of our SUN.

The sun drives all temperature fluctuations here on Earth and then in turn the temperature drives the amount of CO2 released into our atmosphere.

Thats one of the things Al Gore got wrong in his movie, he implied that CO2 drives temperature but the reverse is true.

That is one of the 9 fundimental flaws pointed out about his documentary by the british legal courts.

About the arctic it has melted before and will do so again.

This is not a new phenomenon, as the gloabl warming religion would have us believe.

Title: Re: Temperature data manipulation exposed
Post by muso on Jul 23rd, 2013 at 5:21pm

Ajax wrote on Jul 23rd, 2013 at 2:44pm:
You know that these days the amount of thermometers around the world has been reduced by more than half and the ones left are not in open fields.

They tend to be positioned next to HVAC's or airport runways or tarmac and concrete roads and structures.

The 0.5 degree rise in temperature could also be atrributed to this.


That was debunked long ago.


Quote:
The other thing is most of the warming of the last centrury happened before 1940, now isn't that strange because after 1940 mans production of CO2 went up yet temperatures fell until about the nid 1970's.


What data are you using to back that up? Have a look at this article - or do you consider New Scientist to be a "greenie group" ?
http://www.newscientist.com/article/dn11639-climate-myths-the-cooling-after-1940-shows-co2-does-not-cause-warming.html#.Ue4uPuER-R0

Title: Re: Temperature data manipulation exposed
Post by Ajax on Jul 24th, 2013 at 1:57pm

muso wrote on Jul 23rd, 2013 at 5:21pm:

Ajax wrote on Jul 23rd, 2013 at 2:44pm:
You know that these days the amount of thermometers around the world has been reduced by more than half and the ones left are not in open fields.

They tend to be positioned next to HVAC's or airport runways or tarmac and concrete roads and structures.

The 0.5 degree rise in temperature could also be atrributed to this.


That was debunked long ago.

What data are you using to back that up? Have a look at this article - or do you consider New Scientist to be a "greenie group" ?


Debunked or not it doesn't make sense having a thermometer next to a HVAC system or on the tarmac of a runway.

Wthin that article you posted is a graph, it can be seen there.

Title: Re: Temperature data manipulation exposed
Post by progressiveslol on Feb 2nd, 2014 at 6:26am
From the 'We told you so' department

A paper out of China that quantifies many of the very problems with the US and global surface temperature record we have been discussing for years: the adjustments add more warming than the global warming signal  itself

A paper just published in Theoretical and Applied Climatology finds that the data homogenization techniques commonly used to adjust temperature records for moving stations and the urban heat island effect [UHI] can result in a “significant” exaggeration of warming trends in the homogenized record.

The effect of homogenization is clear and quite pronounced. What they found in China is based on how NOAA treats homogenization of the surface temperature record.


According to the authors:

“Our analysis shows that “data homogenization for [temperature] stations moved from downtowns to suburbs can lead to a significant overestimate of rising trends of surface air temperature.”

Basically what they are saying here is that the heat sink effect of all the concrete and asphalt surrounding the station swamps the diurnal variation of the station, and when it is moved away, the true diurnal variation returns, and then the homogenization methodology falsely adjusts the signal in a way that increases the trend.

You can see the heat sink swamping of the diurnal signal in the worst stations, Class 5, nearest urban centers in the graphs below. Compare urban, semi-urban, and rural for Class 5 stations, the effect of the larger UHI heat sink on the Tmax and Tmin is evident.


http://wattsupwiththat.com/2014/01/29/important-study-on-temperature-adjustments-homogenization-can-lead-to-a-significant-overestimate-of-rising-trends-of-surface-air-temperature/

Title: Re: Temperature data manipulation exposed
Post by progressiveslol on May 7th, 2014 at 1:38pm
The climate reality our government is living in is little more than a self-serving construct.

Final fraud temp MINUS RAW

See where the rising temperatures are coming from. Purely coming from the pseudo climate science community, not from nature


http://wattsupwiththat.com/2014/05/06/ive-been-waiting-for-this-statement-and-the-national-climate-assessment-has-helpfully-provided-it

Title: Re: Temperature data manipulation exposed
Post by Pastafarian on May 7th, 2014 at 1:41pm
Yay science finds new ways to present data. Welcome to how science works

Title: Re: Temperature data manipulation exposed
Post by Mx Horse on May 7th, 2014 at 2:21pm
FACT, of the purest kind :

The ipcc reports are necessarily conservative due to all governments having to agree what is included..........

Panic is here!!

Title: Re: Temperature data manipulation exposed
Post by Sparky on May 7th, 2014 at 3:54pm
whats going to be the next doomsday prophecy/science fraud when this crap becomes a trivial pursuit question?


Title: Re: Temperature data manipulation exposed
Post by gizmo_2655 on May 7th, 2014 at 4:03pm

Sparky wrote on May 7th, 2014 at 3:54pm:
whats going to be the next doomsday prophecy/science fraud when this crap becomes a trivial pursuit question?


Aren't they warming up the Zombie Apocalypse or a Dinosaur Killer Asteroid Collision??

Title: Re: Temperature data manipulation exposed
Post by Mx Horse on May 7th, 2014 at 4:52pm

gizmo_2655 wrote on May 7th, 2014 at 4:03pm:

Sparky wrote on May 7th, 2014 at 3:54pm:
whats going to be the next doomsday prophecy/science fraud when this crap becomes a trivial pursuit question?


Aren't they warming up the Zombie Apocalypse or a Dinosaur Killer Asteroid Collision??

Just ask the nearest real estate agents son or daughter...they even know climate change is happening but expect their vote, expected by daddy in return for the house whilst they were too high to compete in the workplace, will be usurped by a higher power and sanity will return to the world somehow...  :D :D :D :D : yeh, go the clever country full of methed up tryhard MIDDLE-upper-CLASS-holes!

** WE ALL KNOW I DON'T BREATHE A WORD OF A LIE INCLUDING THE ALMIGHTY ANDREI!  :o :o  :-[

Title: Re: Temperature data manipulation exposed
Post by mattywisk on May 8th, 2014 at 11:25pm

gizmo_2655 wrote on May 7th, 2014 at 4:03pm:

Sparky wrote on May 7th, 2014 at 3:54pm:
whats going to be the next doomsday prophecy/science fraud when this crap becomes a trivial pursuit question?


Aren't they warming up the Zombie Apocalypse or a Dinosaur Killer Asteroid Collision??


I think the latest is the Asteroid Apocalypse as we approach 18 years of no global warming.

Title: Re: Temperature data manipulation exposed
Post by IQSRLOW on May 9th, 2014 at 10:18am
An asteroid is probably what they are hoping for...

As Wils said
"What if climate change appears to be just mainly a multidecadal natural fluctuation? They'll kill us probably ..."

Title: Re: Temperature data manipulation exposed
Post by rabbitoh08 on May 9th, 2014 at 12:38pm

Mattywisk wrote on May 8th, 2014 at 11:25pm:

gizmo_2655 wrote on May 7th, 2014 at 4:03pm:

Sparky wrote on May 7th, 2014 at 3:54pm:
whats going to be the next doomsday prophecy/science fraud when this crap becomes a trivial pursuit question?


Aren't they warming up the Zombie Apocalypse or a Dinosaur Killer Asteroid Collision??


I think the latest is the Asteroid Apocalypse as we approach 18 years of no global warming.

When was there 18 years of no global warming?

The arctic continues to melt
Sea levels continue to rise
Global glacial mass balance continues to decline

Why is this happening if there has been "18 years of no global warming"?!?!

Any hints?

Title: Re: Temperature data manipulation exposed
Post by rabbitoh08 on May 9th, 2014 at 12:41pm

progressiveslol wrote on Feb 2nd, 2014 at 6:26am:
From the 'We told you so' department

A paper out of China that quantifies many of the very problems with the US and global surface temperature record we have been discussing for years: the adjustments add more warming than the global warming signal  itself

A paper just published in Theoretical and Applied Climatology finds that the data homogenization techniques commonly used to adjust temperature records for moving stations and the urban heat island effect [UHI] can result in a “significant” exaggeration of warming trends in the homogenized record.

The effect of homogenization is clear and quite pronounced. What they found in China is based on how NOAA treats homogenization of the surface temperature record.


According to the authors:

“Our analysis shows that “data homogenization for [temperature] stations moved from downtowns to suburbs can lead to a significant overestimate of rising trends of surface air temperature.”

Basically what they are saying here is that the heat sink effect of all the concrete and asphalt surrounding the station swamps the diurnal variation of the station, and when it is moved away, the true diurnal variation returns, and then the homogenization methodology falsely adjusts the signal in a way that increases the trend.

You can see the heat sink swamping of the diurnal signal in the worst stations, Class 5, nearest urban centers in the graphs below. Compare urban, semi-urban, and rural for Class 5 stations, the effect of the larger UHI heat sink on the Tmax and Tmin is evident.


http://wattsupwiththat.com/2014/01/29/important-study-on-temperature-adjustments-homogenization-can-lead-to-a-significant-overestimate-of-rising-trends-of-surface-air-temperature/

A paper about one weather station in suburban Beijing "quantifies many of the very problems with the US and global surface temperature record"?!?!  Really?!?!

Title: Re: Temperature data manipulation exposed
Post by rabbitoh08 on May 9th, 2014 at 12:43pm

progressiveslol wrote on May 7th, 2014 at 1:38pm:
The climate reality our government is living in is little more than a self-serving construct.

Final fraud temp MINUS RAW

See where the rising temperatures are coming from. Purely coming from the pseudo climate science community, not from nature


http://wattsupwiththat.com/2014/05/06/ive-been-waiting-for-this-statement-and-the-national-climate-assessment-has-helpfully-provided-it

I see.  So the planet isn't warming after all!!!

Then why is that:

The arctic continues to melt
Sea levels continue to rise
Global glacial mass balance continues to decline

Does your nutjob conspiracy theory blog explain that?

Title: Re: Temperature data manipulation exposed
Post by Rider on May 9th, 2014 at 4:22pm

rabbitoh08 wrote on May 9th, 2014 at 12:41pm:

progressiveslol wrote on Feb 2nd, 2014 at 6:26am:
From the 'We told you so' department

A paper out of China that quantifies many of the very problems with the US and global surface temperature record we have been discussing for years: the adjustments add more warming than the global warming signal  itself

A paper just published in Theoretical and Applied Climatology finds that the data homogenization techniques commonly used to adjust temperature records for moving stations and the urban heat island effect [UHI] can result in a “significant” exaggeration of warming trends in the homogenized record.

The effect of homogenization is clear and quite pronounced. What they found in China is based on how NOAA treats homogenization of the surface temperature record.


According to the authors:

“Our analysis shows that “data homogenization for [temperature] stations moved from downtowns to suburbs can lead to a significant overestimate of rising trends of surface air temperature.”

Basically what they are saying here is that the heat sink effect of all the concrete and asphalt surrounding the station swamps the diurnal variation of the station, and when it is moved away, the true diurnal variation returns, and then the homogenization methodology falsely adjusts the signal in a way that increases the trend.

You can see the heat sink swamping of the diurnal signal in the worst stations, Class 5, nearest urban centers in the graphs below. Compare urban, semi-urban, and rural for Class 5 stations, the effect of the larger UHI heat sink on the Tmax and Tmin is evident.


http://wattsupwiththat.com/2014/01/29/important-study-on-temperature-adjustments-homogenization-can-lead-to-a-significant-overestimate-of-rising-trends-of-surface-air-temperature/

A paper about one weather station in suburban Beijing "quantifies many of the very problems with the US and global surface temperature record"?!?!  Really?!?!


Someone's in denial.

Title: Re: Temperature data manipulation exposed
Post by rabbitoh08 on May 9th, 2014 at 4:53pm

Rider wrote on May 9th, 2014 at 4:22pm:

rabbitoh08 wrote on May 9th, 2014 at 12:41pm:

progressiveslol wrote on Feb 2nd, 2014 at 6:26am:
From the 'We told you so' department

A paper out of China that quantifies many of the very problems with the US and global surface temperature record we have been discussing for years: the adjustments add more warming than the global warming signal  itself

A paper just published in Theoretical and Applied Climatology finds that the data homogenization techniques commonly used to adjust temperature records for moving stations and the urban heat island effect [UHI] can result in a “significant” exaggeration of warming trends in the homogenized record.

The effect of homogenization is clear and quite pronounced. What they found in China is based on how NOAA treats homogenization of the surface temperature record.


According to the authors:

“Our analysis shows that “data homogenization for [temperature] stations moved from downtowns to suburbs can lead to a significant overestimate of rising trends of surface air temperature.”

Basically what they are saying here is that the heat sink effect of all the concrete and asphalt surrounding the station swamps the diurnal variation of the station, and when it is moved away, the true diurnal variation returns, and then the homogenization methodology falsely adjusts the signal in a way that increases the trend.

You can see the heat sink swamping of the diurnal signal in the worst stations, Class 5, nearest urban centers in the graphs below. Compare urban, semi-urban, and rural for Class 5 stations, the effect of the larger UHI heat sink on the Tmax and Tmin is evident.


http://wattsupwiththat.com/2014/01/29/important-study-on-temperature-adjustments-homogenization-can-lead-to-a-significant-overestimate-of-rising-trends-of-surface-air-temperature/

A paper about one weather station in suburban Beijing "quantifies many of the very problems with the US and global surface temperature record"?!?!  Really?!?!


Someone's in denial.

Shoosh you. They don't like to be called "deniers".  They think that by ignoring the vast mountains of scientific evidence and then trusting blindly some nutjobs blog about a weather station in suburban Beijing that they are being "sceptical"!

Title: Re: Temperature data manipulation exposed
Post by IQSRLOW on May 9th, 2014 at 5:25pm

Quote:
Then why is that:

The arctic continues to melt
Sea levels continue to rise
Global glacial mass balance continues to decline


The simple explanation is that you are wrong on all three counts. Perhaps you should study the science?

I don't understand why you deniers continue to ignore the science.

Title: Re: Temperature data manipulation exposed
Post by gizmo_2655 on May 9th, 2014 at 5:37pm

rabbitoh08 wrote on May 9th, 2014 at 4:53pm:

Rider wrote on May 9th, 2014 at 4:22pm:

rabbitoh08 wrote on May 9th, 2014 at 12:41pm:

progressiveslol wrote on Feb 2nd, 2014 at 6:26am:
From the 'We told you so' department

A paper out of China that quantifies many of the very problems with the US and global surface temperature record we have been discussing for years: the adjustments add more warming than the global warming signal  itself

A paper just published in Theoretical and Applied Climatology finds that the data homogenization techniques commonly used to adjust temperature records for moving stations and the urban heat island effect [UHI] can result in a “significant” exaggeration of warming trends in the homogenized record.

The effect of homogenization is clear and quite pronounced. What they found in China is based on how NOAA treats homogenization of the surface temperature record.


According to the authors:

“Our analysis shows that “data homogenization for [temperature] stations moved from downtowns to suburbs can lead to a significant overestimate of rising trends of surface air temperature.”

Basically what they are saying here is that the heat sink effect of all the concrete and asphalt surrounding the station swamps the diurnal variation of the station, and when it is moved away, the true diurnal variation returns, and then the homogenization methodology falsely adjusts the signal in a way that increases the trend.

You can see the heat sink swamping of the diurnal signal in the worst stations, Class 5, nearest urban centers in the graphs below. Compare urban, semi-urban, and rural for Class 5 stations, the effect of the larger UHI heat sink on the Tmax and Tmin is evident.


http://wattsupwiththat.com/2014/01/29/important-study-on-temperature-adjustments-homogenization-can-lead-to-a-significant-overestimate-of-rising-trends-of-surface-air-temperature/

A paper about one weather station in suburban Beijing "quantifies many of the very problems with the US and global surface temperature record"?!?!  Really?!?!


Someone's in denial.

Shoosh you. They don't like to be called "deniers".  They think that by ignoring the vast mountains of scientific evidence and then trusting blindly some nutjobs blog about a weather station in suburban Beijing that they are being "sceptical"!


Yup YOU are in 'denial'

Title: Re: Temperature data manipulation exposed
Post by Rider on May 9th, 2014 at 6:37pm

gizmo_2655 wrote on May 9th, 2014 at 5:37pm:

rabbitoh08 wrote on May 9th, 2014 at 4:53pm:

Rider wrote on May 9th, 2014 at 4:22pm:

rabbitoh08 wrote on May 9th, 2014 at 12:41pm:

progressiveslol wrote on Feb 2nd, 2014 at 6:26am:
From the 'We told you so' department

A paper out of China that quantifies many of the very problems with the US and global surface temperature record we have been discussing for years: the adjustments add more warming than the global warming signal  itself

A paper just published in Theoretical and Applied Climatology finds that the data homogenization techniques commonly used to adjust temperature records for moving stations and the urban heat island effect [UHI] can result in a “significant” exaggeration of warming trends in the homogenized record.

The effect of homogenization is clear and quite pronounced. What they found in China is based on how NOAA treats homogenization of the surface temperature record.


According to the authors:

“Our analysis shows that “data homogenization for [temperature] stations moved from downtowns to suburbs can lead to a significant overestimate of rising trends of surface air temperature.”

Basically what they are saying here is that the heat sink effect of all the concrete and asphalt surrounding the station swamps the diurnal variation of the station, and when it is moved away, the true diurnal variation returns, and then the homogenization methodology falsely adjusts the signal in a way that increases the trend.

You can see the heat sink swamping of the diurnal signal in the worst stations, Class 5, nearest urban centers in the graphs below. Compare urban, semi-urban, and rural for Class 5 stations, the effect of the larger UHI heat sink on the Tmax and Tmin is evident.


http://wattsupwiththat.com/2014/01/29/important-study-on-temperature-adjustments-homogenization-can-lead-to-a-significant-overestimate-of-rising-trends-of-surface-air-temperature/

A paper about one weather station in suburban Beijing "quantifies many of the very problems with the US and global surface temperature record"?!?!  Really?!?!


Someone's in denial.

Shoosh you. They don't like to be called "deniers".  They think that by ignoring the vast mountains of scientific evidence and then trusting blindly some nutjobs blog about a weather station in suburban Beijing that they are being "sceptical"!


Yup YOU are in 'denial'


  ;)

Title: Re: Temperature data manipulation exposed
Post by rabbitoh08 on May 9th, 2014 at 6:44pm

IQSRLOW wrote on May 9th, 2014 at 5:25pm:

Quote:
Then why is that:

The arctic continues to melt
Sea levels continue to rise
Global glacial mass balance continues to decline


The simple explanation is that you are wrong on all three counts. Perhaps you should study the science?

I don't understand why you deniers continue to ignore the science.

I am wrong on all 3 counts am I?!?!

Really?!?!?  Are you sure?
You realise were are discussing earth?  Not whatever planet your information is beaming from?

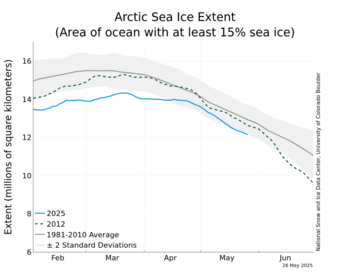
The arctic continues to melt
Average ice extent for April 2014 was the fifth lowest for the month in the satellite record. Through 2014, the linear rate of decline for April ice extent is -2.4% per decade relative to the 1981 to 2010 average.
http://nsidc.org/arcticseaicenews/

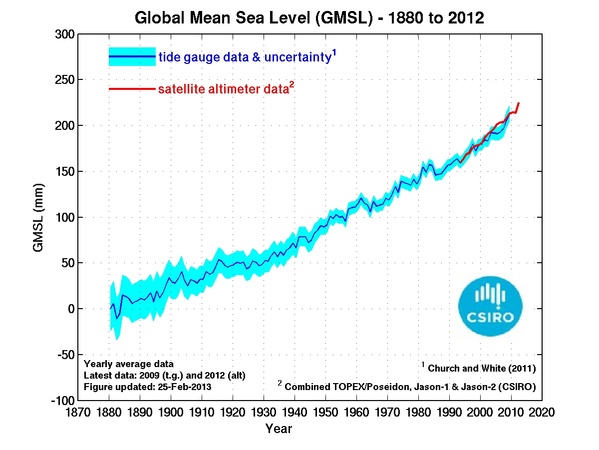
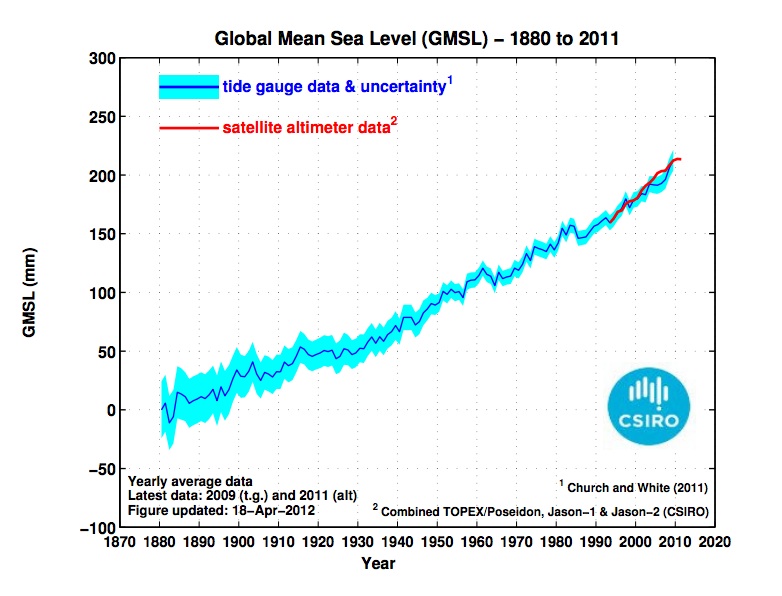
Sea levels continue to rise

We have used a combination of historical tide-gauge data and satellite-altimeter data to estimate global averaged sea level change from 1880 to 2009. During this period, global-averaged sea level rose about 21 cm, with an average rate of rise of about 1.6 mm/yr over the 20th Century. The sea level record indicates a statistically significant increase in the rate of rise between 1880 to 2009
http://www.cmar.csiro.au/sealevel/sl_hist_few_hundred.html

Global glacial mass balance continues to decline
Taking the two years of this reporting period together, the mean mass balance was −970 mm w.e. per year. This is more negative than the mean mass balance for the first decade of the 21st century (2000−2009: −668 mm w.e. per year) and continues the trend to more negative annual balances of the past three decades.
http://www.wgms.ch/mbb/mbb12/wgms_2013_gmbb12.pdf

So - it appears that I was exactly correct on all three counts.  Perhaps you could explain to us all what this "science" is you claim that I am denying?  The latest paper by Professor Andrew Bolt perhaps?  Dr Alan Jones?

Why did you try to tell a lie and tell me I was wrong?
Who did you think you would fool with that?

And can you explain to us why:
The arctic continues to melt
Sea levels continue to rise
Global glacial mass balance continues to decline

If - as some earlier idiot claimed, there has been "18 years of no global warming"?!?!

Title: Re: Temperature data manipulation exposed
Post by rabbitoh08 on May 9th, 2014 at 6:47pm

gizmo_2655 wrote on May 9th, 2014 at 5:37pm:

rabbitoh08 wrote on May 9th, 2014 at 4:53pm:

Rider wrote on May 9th, 2014 at 4:22pm:

rabbitoh08 wrote on May 9th, 2014 at 12:41pm:

progressiveslol wrote on Feb 2nd, 2014 at 6:26am:
From the 'We told you so' department

A paper out of China that quantifies many of the very problems with the US and global surface temperature record we have been discussing for years: the adjustments add more warming than the global warming signal  itself

A paper just published in Theoretical and Applied Climatology finds that the data homogenization techniques commonly used to adjust temperature records for moving stations and the urban heat island effect [UHI] can result in a “significant” exaggeration of warming trends in the homogenized record.

The effect of homogenization is clear and quite pronounced. What they found in China is based on how NOAA treats homogenization of the surface temperature record.


According to the authors:

“Our analysis shows that “data homogenization for [temperature] stations moved from downtowns to suburbs can lead to a significant overestimate of rising trends of surface air temperature.”

Basically what they are saying here is that the heat sink effect of all the concrete and asphalt surrounding the station swamps the diurnal variation of the station, and when it is moved away, the true diurnal variation returns, and then the homogenization methodology falsely adjusts the signal in a way that increases the trend.

You can see the heat sink swamping of the diurnal signal in the worst stations, Class 5, nearest urban centers in the graphs below. Compare urban, semi-urban, and rural for Class 5 stations, the effect of the larger UHI heat sink on the Tmax and Tmin is evident.


http://wattsupwiththat.com/2014/01/29/important-study-on-temperature-adjustments-homogenization-can-lead-to-a-significant-overestimate-of-rising-trends-of-surface-air-temperature/

A paper about one weather station in suburban Beijing "quantifies many of the very problems with the US and global surface temperature record"?!?!  Really?!?!


Someone's in denial.

Shoosh you. They don't like to be called "deniers".  They think that by ignoring the vast mountains of scientific evidence and then trusting blindly some nutjobs blog about a weather station in suburban Beijing that they are being "sceptical"!


Yup YOU are in 'denial'

Do you have anything of value to add?

Are you one of these people that think that ignoring the vast mountains of scientific evidence and then trusting blindly some nutjobs blog about a weather station in suburban Beijing that they are being "sceptical"!

Why?

Are you genuinely confused by the subject?
I would be happy to explain to you whatever it is you don't understand.

Title: Re: Temperature data manipulation exposed
Post by IQSRLOW on May 9th, 2014 at 8:20pm

Quote:
If - as some earlier idiot claimed, there has been "18 years of no global warming"?!?!


Why would I even try to discuss the science with a denier who refuses to admit what the science says and that is that there has been no significant warming for nearly 18 years. Claiming "then why" doesn't change the facts. It just makes you a denier.

Title: Re: Temperature data manipulation exposed
Post by rabbitoh08 on May 9th, 2014 at 9:49pm

IQSRLOW wrote on May 9th, 2014 at 8:20pm:

Quote:
If - as some earlier idiot claimed, there has been "18 years of no global warming"?!?!


Why would I even try to discuss the science with a denier who refuses to admit what the science says and that is that there has been no significant warming for nearly 18 years. Claiming "then why" doesn't change the facts. It just makes you a denier.

Oh dear!  Still persisting with your fantasy?

What is this "science" I am "denying"?
You still haven't shown us?

It has just been demonstrated that you are a pathetic little liar.  I told you that:
- The arctic continues to melt
- Sea levels continue to rise
- Global glacial mass balance continues to decline

You told me I was wrong on all three counts.  You were shown evidence in Post #58 of this thread that I was correct all 3 counts.
Want more evidence?
I will be happy to show it - you only need to ask.

But evidence to support your claim?!?!  Where is it?!?!?!
Nothing
Nil
Zilch
Nada
Bugger all.

You are a pathetic liar.  You are not fooling any body.

Now you tell us:
there has been no significant warming for nearly 18 years

This is complete bollocks.
I ask you again:

Why is it that :
The arctic continues to melt?
Sea levels continue to rise?
Global glacial mass balance continues to decline?

Why is this happening if there has been "18 years of no global warming"?!?!

Any answer at all?
What does Professor Andrew Bolt say about the question?
I'm sure you can you tell us?

Come on Champ.
What have you got?
Come and show us just how ignorant you are.

We are waiting....

Title: Re: Temperature data manipulation exposed
Post by rabbitoh08 on May 9th, 2014 at 9:57pm

IQSRLOW wrote on May 9th, 2014 at 8:20pm:

Quote:
If - as some earlier idiot claimed, there has been "18 years of no global warming"?!?!


Why would I even try to discuss the science with a denier who refuses to admit what the science says and that is that there has been no significant warming for nearly 18 years.

No "science" says there has been "no significant warming for nearly 18 years".  You are making things up


IQSRLOW wrote on May 9th, 2014 at 8:20pm:
Claiming "then why" doesn't change the facts.
No "science" says there has been "no significant warming for nearly 18 years".  You are making things up

And the FACT that:
The arctic continues to melt
Sea levels continue to rise, and
Global glacial mass balance continues to decline

Shows that the claim of "no significant warming for nearly 18 years" pure bollocks.

Fact are fact champ.  You can't just make up your own.


IQSRLOW wrote on May 9th, 2014 at 8:20pm:
It just makes you a denier.

The arctic continues to melt
Sea levels continue to rise, and
Global glacial mass balance continues to decline

Why do you deny this?

Title: Re: Temperature data manipulation exposed
Post by greggerypeccary on May 9th, 2014 at 11:24pm

rabbitoh08 wrote on May 9th, 2014 at 9:57pm:
The arctic continues to melt
Sea levels continue to rise, and
Global glacial mass balance continues to decline


Prove it.


Title: Re: Temperature data manipulation exposed
Post by IQSRLOW on May 9th, 2014 at 11:28pm
If you are unaware of the temperature record that there has been no significant warming for nearly 18 years, then I'm afraid pointing out where you are wrong would be pointless. You haven't educated yourself enough regarding the science and deny the current situation.

I cannot convince a denier and someone with 'faith' on AGW because your mind is closed to the truth. Your belief outweighs the science and reality.

If you were truly across this issue,you would already know about the hiatus in the warming, but you don't so all that tells me is that you deny the empirical evidence for anecdotal observations that support your fanatical religion but have nothing to do with the halt in temperature despite massive increases in CO2 output.

Please, continue with your denial. It is amusing to watch a denier, denying and ignoring the science and evidence.

Let me know when you have educated yourself regarding the state of AGW and the scientific proof of the hiatus. If you are not willing to do that, then there is no point in trying to challenge your religion with facts and science.

Title: Re: Temperature data manipulation exposed
Post by progressiveslol on May 10th, 2014 at 1:29am

Quote:
“We know that global warming due to human impacts can’t explain why it got warm so fast,” said lead study author Qinghua Ding, a climate scientist at the University of Washington.


Rabbit is a denier

Title: Re: Temperature data manipulation exposed
Post by rabbitoh08 on May 10th, 2014 at 9:32am

greggerypeccary wrote on May 9th, 2014 at 11:24pm:

rabbitoh08 wrote on May 9th, 2014 at 9:57pm:
The arctic continues to melt
Sea levels continue to rise, and
Global glacial mass balance continues to decline


Prove it.

Post #58

Title: Re: Temperature data manipulation exposed
Post by greggerypeccary on May 10th, 2014 at 9:38am

rabbitoh08 wrote on May 10th, 2014 at 9:32am:

greggerypeccary wrote on May 9th, 2014 at 11:24pm:

rabbitoh08 wrote on May 9th, 2014 at 9:57pm:
The arctic continues to melt
Sea levels continue to rise, and
Global glacial mass balance continues to decline


Prove it.

Post #58


Not good enough.

"We have used a combination of historical tide-gauge data and satellite-altimeter data to estimate global averaged sea level change from 1880 to 2009."


Title: Re: Temperature data manipulation exposed
Post by rabbitoh08 on May 10th, 2014 at 9:49am

IQSRLOW wrote on May 9th, 2014 at 11:28pm:
If you are unaware of the temperature record that there has been no significant warming for nearly 18 years, then I'm afraid pointing out where you are wrong would be pointless.

So - are you only referring to the surface temperature?  And the fact that there was an anomalously high surface temperature in 1998 due to the El Nino  of that year?

Yes - I am aware of that.  But the claim was that there has been no global warming for 18 years - which is of course - complete bollocks.  There global temperature is far more than just the surface temperature.

That is why:
The arctic continues to melt
Sea levels continue to rise, and
Global glacial mass balance continues to decline

You are talking bollocks.  And your inability to provide any evidence to support your bollocks, implies that you also know you are talking bollocks.

You are telling lies.


IQSRLOW wrote on May 9th, 2014 at 11:28pm:
You haven't educated yourself enough regarding the science and deny the current situation.

You are the one telling lies buddy.

I told you:
The arctic continues to melt
Sea levels continue to rise, and
Global glacial mass balance continues to decline

You told me I was wrong on all three counts.  I showed you evidence that backed up my statement.

What have you got liar?


IQSRLOW wrote on May 9th, 2014 at 11:28pm:
I cannot convince a denier and someone with 'faith' on AGW because your mind is closed to the truth. Your belief outweighs the science and reality.

You are the one in denial buddy

I told you:
The arctic continues to melt
Sea levels continue to rise, and
Global glacial mass balance continues to decline

You told me I was wrong on all three counts.  I showed you evidence that backed up my statement.

What have you got liar?


IQSRLOW wrote on May 9th, 2014 at 11:28pm:
If you were truly across this issue,you would already know about the hiatus in the warming, but you don't so all that tells me is that you deny the empirical evidence for anecdotal observations that support your fanatical religion but have nothing to do with the halt in temperature despite massive increases in CO2 output.


If you have any idea what you were talking about - you would know that there is more to the planets heat content than simply the surface temperature.

But you don't You are ignorant, and believe whatever Bolty tells you.

The SIMPLE FACT is  - that is , as has been observed:
The arctic continues to melt
Sea levels continue to rise, and
Global glacial mass balance continues to decline

Then the planet is warming.

If the planet was not continuing to warm:
The arctic would not continue to melt
Sea levels would not continue to rise, and
Global glacial mass balance would not continue to decline

And even surface temperature, which you seem to want to cherry pick - average global surface temperatures have had a positive anomaly over long term average over all of the past decade.  This means the planet is warming.

Yes - I know an opinion piece by David Rose in the Daily Mail told you different (that is where all this "no warming" crap originated) - but you are wrong.  David Rose is wrong.  Andrew Bolt is wrong.


IQSRLOW wrote on May 9th, 2014 at 11:28pm:
Please, continue with your denial. It is amusing to watch a denier, denying and ignoring the science and evidence.

Let me know when you have educated yourself regarding the state of AGW and the scientific proof of the hiatus. If you are not willing to do that, then there is no point in trying to challenge your religion with facts and science.

Do yourself a favour champ.

Have a think about where this planet stores heat.  THink about the oceans.  Think about the cryosphere. Think about the atmosphere.  And then come back to us and tell us why you want to measure global warming only by the temperature at the earth's surface.

And then explain to us why:

The arctic continues to melt
Sea levels continue to rise, and
Global glacial mass balance continues to decline

If - as you claim - there has been "no warming for 18 years".

Could you do that?

And perhaps try to provide some evidence to support your opinion.  Could you do that?

Title: Re: Temperature data manipulation exposed
Post by rabbitoh08 on May 10th, 2014 at 9:56am

greggerypeccary wrote on May 10th, 2014 at 9:38am:

rabbitoh08 wrote on May 10th, 2014 at 9:32am:

greggerypeccary wrote on May 9th, 2014 at 11:24pm:

rabbitoh08 wrote on May 9th, 2014 at 9:57pm:
The arctic continues to melt
Sea levels continue to rise, and
Global glacial mass balance continues to decline


Prove it.

Post #58


Not good enough.

"We have used a combination of historical tide-gauge data and satellite-altimeter data to estimate global averaged sea level change from 1880 to 2009."

Don't be silly Greggery.

Empirical data is empirical data.  And all current empirical data availaible to date indicates that globally:

The arctic continues to melt
Sea levels continue to rise, and
Global glacial mass balance continues to decline

and no available empirical data to date indicates the contrary.

To try to pretend that the data does not exist makes you sound as retarded as that IQS idiot.

Title: Re: Temperature data manipulation exposed
Post by rabbitoh08 on May 10th, 2014 at 10:05am

progressiveslol wrote on May 10th, 2014 at 1:29am:

Quote:
“We know that global warming due to human impacts can’t explain why it got warm so fast,” said lead study author Qinghua Ding, a climate scientist at the University of Washington.


Rabbit is a denier

errrr....do you have any idea what you are quoting there?

Could you explain why you think it is relevant here?
Could you explain what you think I am "denying"?
Could you show us where I have ever denied that the North Atlantic Oscillation impacts upon Greenland?

And could you explain to us - why you think that randomly quoting things you don't understand doesn't make you sound really stupid?

Title: Re: Temperature data manipulation exposed
Post by IQSRLOW on May 10th, 2014 at 10:43am
The claim is that there has been no glabal warming for 17 years and 8 months and it goes back to 1996


You can deny all you like, denier. I'm sorry the science doesn't fit your religion.

Quote:
The arctic continues to melt
Sea levels continue to rise, and
Global glacial mass balance continues to decline


Do you like describing natural occurrences or do you have incontrovertible evidence that the above is caused by man?

Title: Re: Temperature data manipulation exposed
Post by Mx Horse on May 10th, 2014 at 7:47pm

greggerypeccary wrote on May 9th, 2014 at 11:24pm:

rabbitoh08 wrote on May 9th, 2014 at 9:57pm:
The arctic continues to melt
Sea levels continue to rise, and
Global glacial mass balance continues to decline


Prove it.

science doesn't prove  ;) ;)

Title: Re: Temperature data manipulation exposed
Post by Mx Horse on May 10th, 2014 at 7:50pm

rabbitoh08 wrote on May 10th, 2014 at 9:49am:

IQSRLOW wrote on May 9th, 2014 at 11:28pm:
If you are unaware of the temperature record that there has been no significant warming for nearly 18 years, then I'm afraid pointing out where you are wrong would be pointless.

So - are you only referring to the surface temperature?  And the fact that there was an anomalously high surface temperature in 1998 due to the El Nino  of that year?

Yes - I am aware of that.  But the claim was that there has been no global warming for 18 years - which is of course - complete bollocks.  There global temperature is far more than just the surface temperature.

That is why:
The arctic continues to melt
Sea levels continue to rise, and
Global glacial mass balance continues to decline

You are talking bollocks.  And your inability to provide any evidence to support your bollocks, implies that you also know you are talking bollocks.

You are telling lies.


IQSRLOW wrote on May 9th, 2014 at 11:28pm:
You haven't educated yourself enough regarding the science and deny the current situation.

You are the one telling lies buddy.

I told you:
The arctic continues to melt
Sea levels continue to rise, and
Global glacial mass balance continues to decline

You told me I was wrong on all three counts.  I showed you evidence that backed up my statement.

What have you got liar?


IQSRLOW wrote on May 9th, 2014 at 11:28pm:
I cannot convince a denier and someone with 'faith' on AGW because your mind is closed to the truth. Your belief outweighs the science and reality.

You are the one in denial buddy

I told you:
The arctic continues to melt
Sea levels continue to rise, and
Global glacial mass balance continues to decline

You told me I was wrong on all three counts.  I showed you evidence that backed up my statement.

What have you got liar?


IQSRLOW wrote on May 9th, 2014 at 11:28pm:
If you were truly across this issue,you would already know about the hiatus in the warming, but you don't so all that tells me is that you deny the empirical evidence for anecdotal observations that support your fanatical religion but have nothing to do with the halt in temperature despite massive increases in CO2 output.


If you have any idea what you were talking about - you would know that there is more to the planets heat content than simply the surface temperature.

But you don't You are ignorant, and believe whatever Bolty tells you.

The SIMPLE FACT is  - that is , as has been observed:
The arctic continues to melt
Sea levels continue to rise, and
Global glacial mass balance continues to decline

Then the planet is warming.

If the planet was not continuing to warm:
The arctic would not continue to melt
Sea levels would not continue to rise, and
Global glacial mass balance would not continue to decline

And even surface temperature, which you seem to want to cherry pick - average global surface temperatures have had a positive anomaly over long term average over all of the past decade.  This means the planet is warming.

Yes - I know an opinion piece by David Rose in the Daily Mail told you different (that is where all this "no warming" crap originated) - but you are wrong.  David Rose is wrong.  Andrew Bolt is wrong.


IQSRLOW wrote on May 9th, 2014 at 11:28pm:
Please, continue with your denial. It is amusing to watch a denier, denying and ignoring the science and evidence.

Let me know when you have educated yourself regarding the state of AGW and the scientific proof of the hiatus. If you are not willing to do that, then there is no point in trying to challenge your religion with facts and science.

Do yourself a favour champ.

Have a think about where this planet stores heat.  THink about the oceans.  Think about the cryosphere. Think about the atmosphere.  And then come back to us and tell us why you want to measure global warming only by the temperature at the earth's surface.

And then explain to us why:

The arctic continues to melt
Sea levels continue to rise, and
Global glacial mass balance continues to decline

If - as you claim - there has been "no warming for 18 years".

Could you do that?

And perhaps try to provide some evidence to support your opinion.  Could you do that?

lies, damned lies and statistics ay!!!!!!!!!!!!!!!!!!!!!!!!!!!!!!!!!!!!!!!  ::)

::) another 3 billion word circle party and iq came bac ::) just in time  :o :o

Title: Re: Temperature data manipulation exposed
Post by IQSRLOW on May 10th, 2014 at 9:34pm
The AGW scam is unravelling before your very eyes. It must be hard to take when it's your religion, but the science says your theory is not only failing but the catastrophic claims have made your side a laughing stock.

You only have yourselves to blame. If there was ever a case for over egging a pudding, you lot had your fists up a chickens bum trying to pull the next one out before it was ready.

Comical really.

Title: Re: Temperature data manipulation exposed
Post by Mx Horse on May 11th, 2014 at 12:41am

IQSRLOW wrote on May 10th, 2014 at 9:34pm:
The AGW scam is unravelling before your very eyes. It must be hard to take when it's your religion, but the science says your theory is not only failing but the catastrophic claims have made your side a laughing stock.

You only have yourselves to blame. If there was ever a case for over egging a pudding, you lot had your fists up a chickens bum trying to pull the next one out before it was ready.

Comical really.

Who are we 8-)

Title: Re: Temperature data manipulation exposed
Post by lee on May 11th, 2014 at 12:16pm
rabbitoh08 says

'The arctic continues to melt
Sea levels continue to rise
Global glacial mass balance continues to decline'

Perhaps he/she is advocating a return to the LIA?

That would give increasing Arctic sea ice, reduced sea levels and improving glacial mass. I'm not sure that glacial mass is ever in balance; whatever that means.

What exactly is the optimum temperature?

Should we have a carbon dioxide tax, another LIA, and have people die of cold as they can't afford carboniferous fuel?

More people die of cold than heat.

Title: Re: Temperature data manipulation exposed
Post by Mx Horse on May 11th, 2014 at 3:26pm

lee wrote on May 11th, 2014 at 12:16pm:
rabbitoh08 says

'The arctic continues to melt
Sea levels continue to rise
Global glacial mass balance continues to decline'

Perhaps he/she is advocating a return to the LIA?

That would give increasing Arctic sea ice, reduced sea levels and improving glacial mass. I'm not sure that glacial mass is ever in balance; whatever that means.

What exactly is the optimum temperature?

Should we have a carbon dioxide tax, another LIA, and have people die of cold as they can't afford carboniferous fuel?

More people die of cold than heat.

Wow, so your rationale depends on the appeal to authoritative fact that more people die from cold than heat??

Seriously,  :D :D :D :D :D :D :D :D :D :D :D :D :D :D :D :D :D :D :D :D :D :D :D :D :D :D :D

Selective in the science we choose to listen to aren't we  ::)

Title: Re: Temperature data manipulation exposed
Post by lee on May 11th, 2014 at 4:29pm
Coming out of an Ice Age temperatures go up.

I see no attribution to CO2 as a supposed causal event. So there is no science there.

Title: Re: Temperature data manipulation exposed
Post by Mx Horse on May 11th, 2014 at 4:41pm

lee wrote on May 11th, 2014 at 4:29pm:
Coming out of an Ice Age temperatures go up.

I see no attribution to CO2 as a supposed causal event. So there is no science there.

Graphology is very interesting: even a tradie who left school at 15 understands rates of change where vested interests such as yourself don't, apparently!

** --------------->> Your children know you're a con-artist  :D :D


..sleep well now  ::)

Title: Re: Temperature data manipulation exposed
Post by lee on May 11th, 2014 at 5:14pm

BatteriesNotIncluded wrote on May 11th, 2014 at 4:41pm:
even a tradie who left school at 15 understands rates of change where vested interests such as yourself don't, apparently!


Obviously you missed correlation is not causation.

But even with increasing CO2; how do you explain the IPCC admitted "pause"?
'Some scientists on the IPCC say "natural variability"; but if "natural variability" can explain the "pause", why cannot it also explain the original warming?

Title: Re: Temperature data manipulation exposed
Post by Mx Horse on May 11th, 2014 at 5:17pm

lee wrote on May 11th, 2014 at 5:14pm:

BatteriesNotIncluded wrote on May 11th, 2014 at 4:41pm:
even a tradie who left school at 15 understands rates of change where vested interests such as yourself don't, apparently!


Obviously you missed correlation is not causation.

But even with increasing CO2; how do you explain the IPCC admitted "pause"?
'Some scientists on the IPCC say "natural variability"; but if "natural variability" can explain the "pause", why cannot it also explain the original warming?

Ooooooooooooooh, deflection ay: you are hardcore chessplayer!!

8-) 8-)

Title: Re: Temperature data manipulation exposed
Post by lee on May 11th, 2014 at 5:52pm

BatteriesNotIncluded wrote on May 11th, 2014 at 5:17pm:
Ooooooooooooooh, deflection ay: you are hardcore chessplayer!!


So I take it you can't explain the IPCC position?

I was a 15 year old telegram boy later tradie; is that a trump? :)

Title: Re: Temperature data manipulation exposed
Post by Mx Horse on May 11th, 2014 at 6:01pm

lee wrote on May 11th, 2014 at 5:52pm:

BatteriesNotIncluded wrote on May 11th, 2014 at 5:17pm:
Ooooooooooooooh, deflection ay: you are hardcore chessplayer!!


So I take it you can't explain the IPCC position?

I was a 15 year old telegram boy later tradie; is that a trump? :)

Rates of change:  :D :D :D :D :D :D :D :D :D :D :D :D :D :D :D :D :D :D :D :D :D :D :D

...what gives you the authority to deflect from the question?  8-)

Yes, the whole forum is watching :o :o

Title: Re: Temperature data manipulation exposed
Post by lee on May 11th, 2014 at 6:47pm
Rates of change in connection with what?

CO2 shows a positive rate of change; the rate of change in relation to temperatures has dropped.

Title: Re: Temperature data manipulation exposed
Post by Mx Horse on May 11th, 2014 at 7:44pm

lee wrote on May 11th, 2014 at 6:47pm:
Rates of change in connection with what?

CO2 shows a positive rate of change; the rate of change in relation to temperatures has dropped.

LIES, DAMNED LIES AND STATISTICS: GOOD SHOW  ;) ;)

Title: Re: Temperature data manipulation exposed
Post by progressiveslol on Jun 24th, 2014 at 12:18am
Finally a touch of main stream of this fraudulent temperature data manipulation. Cooling the past and warming the present. Yep, its man made alright.

The scandal of fiddled global warming data
The US has actually been cooling since the Thirties, the hottest decade on record

When future generations try to understand how the world got carried away around the end of the 20th century by the panic over global warming, few things will amaze them more than the part played in stoking up the scare by the fiddling of official temperature data. There was already much evidence of this seven years ago, when I was writing my history of the scare, The Real Global Warming Disaster. But now another damning example has been uncovered by Steven Goddard’s US blog Real Science, showing how shamelessly manipulated has been one of the world’s most influential climate records, the graph of US surface temperature records published by the National Oceanic and Atmospheric Administration (NOAA).


Goddard shows how, in recent years, NOAA’s US Historical Climatology Network (USHCN) has been “adjusting” its record by replacing real temperatures with data “fabricated” by computer models. The effect of this has been to downgrade earlier temperatures and to exaggerate those from recent decades


http://www.telegraph.co.uk/earth/environment/10916086/The-scandal-of-fiddled-global-warming-data.html

NOAA And NASA Data Alterations Are Global

http://stevengoddard.wordpress.com/2014/06/23/noaa-and-nasa-data-alterations-are-global/

My dog can pick the pattern of this fraud. Always, always.. cool the past, warm the present


Title: Re: Temperature data manipulation exposed
Post by Ajax on Jun 29th, 2014 at 1:06am
CO2 increasing temperature decreasing.

CO2 has NEVER controlled temperature here on earth.

Don't believe me, look into our history....!!!!!!!


Title: Re: Temperature data manipulation exposed
Post by Ajax on Jun 29th, 2014 at 1:10am
There is no CO2 crises, all the average person has to do is go and have a look in to history.

If CO2 controlled temperature it would be evident in our history.

There have been times when CO2 has risen and temperature dropped, there have also been times when temperature has risen and CO2 dropped.

The scale that is ALWAYS show by the alarmists is around the 500,000 year time scale which makes it look as though temperature and CO2 correlate.

If you get a time scale of 10,000 years they don't come close.

If you get a time scale of millions of years they don't come close.

If you get todays CO2 emission levels and temperature they DONT correlate far from it.

That's why the alarmists have all these crazy theories that the ocean is sucking up all this extra heat that the extra CO2 is producing.

If the Earth was so finely tunned we would have perished eons ago.

They never tell people that we once had 20 times the amount of CO2 in our atmosphere that we have today and life thrived.

Today we have some of the lowest temperatures and lowest amounts of CO2 in the atmosphere, there have only been one or two instances in our history when we have had so low temperature and CO2.

So when you reach rock bottom there's only one way to go UP.......??????

I love the environment just as much as any greenie but don't p!ss down my back and tell me its raining.

This global warming religion is communism dressed up as environmentalism, the United Nations want to control the worlds energy resources and at the same time to redistribute wealth from the west to under developed nations.

So all you goody two shoes who want to save the environment and have been brained washed by the global warming religion wake up for goodness sake, it can be done without the United nations, the world bank, the IMF and who everelse has their dirty little fingers in the pie.

The reality is when temperature rises CO2 follows with a lag of about 800 years.

Al Gore got it the arse about he told us that CO2 rise and then temperature follows.

What do you honestly expect from a politician....!!!!!!!!


10,000 year time scale


500,000 year time scale (the scale the alarmist ALWAYS use)


millions of year time scale


TODAY


Title: Re: Temperature data manipulation exposed
Post by MOTR on Jun 29th, 2014 at 4:33am

Ajax wrote on Jun 29th, 2014 at 1:10am:
There is no CO2 crises, all the average person has to do is go and have a look in to history.

If CO2 controlled temperature it would be evident in our history.


CO2 is an important driver, however it is not the only driver. Paleoclimatology tells us that CO2 has had a significant influence on global temperatures, however it is not the sole driver of temperatures.


Ajax wrote on Jun 29th, 2014 at 1:10am:
There have been times when CO2 has risen and temperature dropped, there have also been times when temperature has risen and CO2 dropped.


Yes there have been times when temperatures have been low despite a high concentration of CO2 in our atmosphere and times when temperatures have been low, despite a relatively low level of atmospheric CO2. That's because CO2 is not the only driver of climate change.


Ajax wrote on Jun 29th, 2014 at 1:10am:
The scale that is ALWAYS show by the alarmists is around the 500,000 year time scale which makes it look as though temperature and CO2 correlate.

If you get a time scale of 10,000 years they don't come close.

If you get a time scale of millions of years they don't come close.


To understand why the relationship between CO2 and temperature is difficult to discern on a 10 000 year time scale, it's necessary to understand the complex relationship between CO2 and temperature. Firstly, ice core studies have shown that CO2 starts to rise 600-1000 years after Antarctic temperature during glacial terminations. Exiting an ice age, warmings typically take 5000 years to complete, the lag is only about 800 years. For the other 4,200 years, the heat-trapping properties of CO2 act as an amplifier. It is during this period that CO2 drives further temperature increases. Ice core studies show us that, just as in warmings, CO2 lags the coolings by a thousand years or so, sometimes three thousand years. Given these time lags and the multitude of factors that impact on climate, it is not surprising that relationship between CO2 and temperature will not always be clearly discernible on any given 10 000 year time period, particularly one that encompasses a glacial termination.

Step back a little and incorporate a whole sequence of these time frames and the relationship becomes much clearer.


Ajax wrote on Jun 29th, 2014 at 1:10am:
If you get todays CO2 emission levels and temperature they DONT correlate far from it.

That's why the alarmists have all these crazy theories that the ocean is sucking up all this extra heat that the extra CO2 is producing.


I'm not sure what you are identifying as a crazy theory. Are you questioning the physics that has clearly identified the heat-trapping properties of CO2, or the scientific studies that show ocean temperatures are rising. Perhaps you can explain the sea level rises some other way.


Ajax wrote on Jun 29th, 2014 at 1:10am:
If the Earth was so finely tunned we would have perished eons ago.

They never tell people that we once had 20 times the amount of CO2 in our atmosphere that we have today and life thrived.

Today we have some of the lowest temperatures and lowest amounts of CO2 in the atmosphere, there have only been one or two instances in our history when we have had so low temperature and CO2.

So when you reach rock bottom there's only one way to go UP.......??????

I love the environment just as much as any greenie but don't p!ss down my back and tell me its raining.

This global warming religion is communism dressed up as environmentalism, the United Nations want to control the worlds energy resources and at the same time to redistribute wealth from the west to under developed nations.

So all you goody two shoes who want to save the environment and have been brained washed by the global warming religion wake up for goodness sake, it can be done without the United nations, the world bank, the IMF and who everelse has their dirty little fingers in the pie.

The reality is when temperature rises CO2 follows with a lag of about 800 years.

Al Gore got it the arse about he told us that CO2 rise and then temperature follows.

What do you honestly expect from a politician....!!!!!!!!

Title: Re: Temperature data manipulation exposed
Post by progressiveslol on Jun 29th, 2014 at 7:24am
Sorry guys, but this is a thread about data manipulation and boy is there plenty of it around at USHCN

Steve Goddard is right, a statement for all that mocked him

Nearly every station has had the actual temperatures adjusted upwards by about half a degree centigrade.
There are 8, out of the 29 stations, which have “Estimated” temperatures on USHCN. This is a ratio of 28%, which seems to tie in with Steve Goddard’s country-wide assessment.
Of these eight estimates, five are because of missing data, as listed at the bottom. Four of these are now shut.
There seems to be no obvious reason why the other three estimates have been made , at Ellsworth, Liberal and Ottawa. The adjustments at these though don’t appear to be significantly different to the non estimated ones.


In addition to recent temperatures being adjusted upwards, we also find that historical ones have been adjusted down. So, for instance we find that the January 1934 mean temperature at Ashland has been adjusted from 3.78C to 3.10C, whilst at Columbus there is a reduction from 4.00C to 3.52C.

In total, therefore, there has been a warming trend of about 1C added since 1934. It has always been my understanding that the various adjustments made for TOBS, etc, have been made to the historic data, and that present temperatures were left unaltered. Certainly, the cooling adjustments of about half a degree in the 1930’s would seem to tally with what NOAA have been publishing.

But this leaves the question of just why there is a need to continually adjust current temperatures upwards.


http://notalotofpeopleknowthat.wordpress.com/2014/06/28/ushcn-adjustments-in-kansas/


Title: Re: Temperature data manipulation exposed
Post by progressiveslol on Jun 29th, 2014 at 7:26am
Even Anthony Watts is eating humble pie

http://wattsupwiththat.com/2014/06/28/the-scientific-method-is-at-work-on-the-ushcn-temperature-data-set/

Title: Re: Temperature data manipulation exposed
Post by MOTR on Jun 29th, 2014 at 9:15am
Of course there are temperature adjustments, progs. When methodologies change, data has to be adjusted.

Surely, you're not advocating that we should be basing our science on raw data, even when we know the data collection methods have a bias.


Just keep in the back of your mind this is the gap in which progs and others believe they can seed doubt.


Title: Re: Temperature data manipulation exposed
Post by MOTR on Jun 29th, 2014 at 11:54am


I think this is an image of progs. One of the inhabitants of those fringe denialist sites that seem to endlessly resuscitate these zombie myths.

http://www.theguardian.com/environment/climate-consensus-97-per-cent/2014/jun/25/global-warming-zombies-devour-telegraph-fox-news-brains

Title: Re: Temperature data manipulation exposed
Post by lee on Jun 29th, 2014 at 1:46pm

MOTR wrote on Jun 29th, 2014 at 9:15am:
When methodologies change, data has to be adjusted.


Why does data gave to be adjusted- it is data. How much does
'data' have to be adjusted before it is meaningless?

Title: Re: Temperature data manipulation exposed
Post by MOTR on Jun 29th, 2014 at 2:04pm

lee wrote on Jun 29th, 2014 at 1:46pm:

MOTR wrote on Jun 29th, 2014 at 9:15am:
When methodologies change, data has to be adjusted.


Why does data gave to be adjusted- it is data. How much does
'data' have to be adjusted before it is meaningless?


If the time of temperature observation was changed, then wouldn't it be necessary to adjust the raw data.

If Tony Heller, aka Steven Goddard, believes these adjustments are flawed, he should attempt to have his findings published in a peer reviewed scientific journal.

How much the data should be adjusted is a technical question that I don't have the expertise to answer. The point is that adjustments are necessary and are hardly the smoking gun of some sort of massive conspiracy.


Title: Re: Temperature data manipulation exposed
Post by progressiveslol on Jun 29th, 2014 at 3:11pm

lee wrote on Jun 29th, 2014 at 1:46pm:

MOTR wrote on Jun 29th, 2014 at 9:15am:
When methodologies change, data has to be adjusted.


Why does data gave to be adjusted- it is data. How much does
'data' have to be adjusted before it is meaningless?

There are needs and there is fraud. A mixture of both keeps the agw loon dream alive.

Title: Re: Temperature data manipulation exposed
Post by MOTR on Jun 29th, 2014 at 4:19pm
http://www.ncdc.noaa.gov/monitoring-references/faq/temperature-monitoring.php

Here is a straight forward explanation for the adjustments from the National Climatic Data Center.

Perhaps progs could identify the exact adjustments he is questioning and the reasons for his concerns. Or more importantly, perhaps Steven Goddard (or whoever he really is) could publish a peer reviewed paper that actually works towards advancing science in some way.

I hold my breath for neither of these things.


Title: Re: Temperature data manipulation exposed
Post by lee on Jun 30th, 2014 at 12:55pm
How can we ever know that any adjustments to the historical record makes them right? The answer is we can't.

With the use of minimum and maximum thermometers, why is time of reading so important. Surely the importance is accuracy. I would take a bet that a maximum reading at 5pm would be accurate at least 364 days/year.

I can't ever remember a maximum after 5 pm.

Perhaps it is more the systematic adjustments over time. Why the need to change more than once?

Title: Re: Temperature data manipulation exposed
Post by The Stunt-free Horse on Jun 30th, 2014 at 1:17pm

MOTR wrote on Jun 29th, 2014 at 9:15am:
Of course there are temperature adjustments, progs. When methodologies change, data has to be adjusted.

Surely, you're not advocating that we should be basing our science on raw data, even when we know the data collection methods have a bias.


Just keep in the back of your mind this is the gap in which progs and others believe they can seed doubt.

doubt can be sown at every step: deny deny deny!

Title: Re: Temperature data manipulation exposed
Post by The Stunt-free Horse on Jun 30th, 2014 at 1:23pm

lee wrote on Jun 30th, 2014 at 12:55pm:
How can we ever know that any adjustments to the historical record makes them right? The answer is we can't.

With the use of minimum and maximum thermometers, why is time of reading so important. Surely the importance is accuracy. I would take a bet that a maximum reading at 5pm would be accurate at least 364 days/year.

I can't ever remember a maximum after 5 pm.

Perhaps it is more the systematic adjustments over time. Why the need to change more than once?

The trouble lies in the fact people don't understand what temperature is!
Temperature is an indicator of heat content!! It means next to nothing when discussing the system that is climate as it can only ever be a local indicator of heat content- unfortunately that is all anyone understands so to make the science understandable to the public weird concepts such as global average temperature have to be invented to keep the public- who votes - informed.

THIS is why doubt can be thrown in at every stage... it's simply called groupthink!


Title: Re: Temperature data manipulation exposed
Post by The Stunt-free Horse on Jun 30th, 2014 at 1:24pm

lee wrote on Jun 30th, 2014 at 12:55pm:
How can we ever know that any adjustments to the historical record makes them right? The answer is we can't.

With the use of minimum and maximum thermometers, why is time of reading so important. Surely the importance is accuracy. I would take a bet that a maximum reading at 5pm would be accurate at least 364 days/year.

I can't ever remember a maximum after 5 pm.

Perhaps it is more the systematic adjustments over time. Why the need to change more than once?

The trouble lies in the fact people don't understand what temperature is!
Temperature is an indicator of heat content!! It means next to nothing when discussing the system that is climate as it can only ever be a local indicator of heat content- unfortunately that is all anyone understands so to make the science understandable to the public weird concepts such as global average temperature have to be invented to keep the public- who votes - informed.

THIS is why doubt can be thrown in at every stage... it's simply called groupthink!


Title: Re: Temperature data manipulation exposed
Post by lee on Jun 30th, 2014 at 1:35pm
And why has NOOA adjusted temperatures yet again?

July 1936 is now back to being the hottest EVAH.

But it is all hunky dory.

http://wattsupwiththat.com/2014/06/29/noaas-temperature-control-knob-for-the-past-the-present-and-maybe-the-future-july-1936-now-hottest-month-again/#more-112190

Or you can just check it for yourself. ;)

Title: Re: Temperature data manipulation exposed
Post by progressiveslol on Jun 30th, 2014 at 10:04pm
It isn't just the manipulation of known temperatures. If the articles were read, you would have noticed that More Than 40% Of USHCN Station Data Is Fabricated

Yes, fabricated. Yes 40%.

That aint a hockey stick, this is a hockey stick


The graph below is generated by counting the number of reported monthly temperatures in the final and raw data sets. They have lost 30% of their station data since 1990, but still report adjusted temperatures for the missing data.

Title: Re: Temperature data manipulation exposed
Post by MOTR on Jun 30th, 2014 at 10:22pm


To put progs' concerns into perspective, think about this. The US makes up 2% of the earths surface, so in effect he is worried about 2% of the gap between the dark green line and the light green line.


Title: Re: Temperature data manipulation exposed
Post by lee on Jul 1st, 2014 at 11:30am
And the algorithm used by the Americans to calculate the correct historic temperatures is most likely the same algorithm used by BOM, Met etc.

Title: Re: Temperature data manipulation exposed
Post by lee on Jul 1st, 2014 at 11:32am
deleted - dual post delay in posting.

Title: Re: Temperature data manipulation exposed
Post by MOTR on Jul 1st, 2014 at 5:33pm

lee wrote on Jul 1st, 2014 at 11:30am:
And the algorithm used by the Americans to calculate the correct historic temperatures is most likely the same algorithm used by BOM, Met etc.


Have another look at the y axis, lee, it's global.


You would expect that they would be all using best practice. If the person who posts as Steven Goddard had a better methodology they would be using it. The point is that Goddard is not in the business of writing for an educated audience, he is in the business of seeding doubt.

We all know from our own experience that there are practices in all industries and disciplines that may look ill-conceived to the layman, but make perfect sense to those who have technical knowledge and experience in the field.


Title: Re: Temperature data manipulation exposed
Post by progressiveslol on Jul 1st, 2014 at 8:32pm
Looks like it is time the GHCN data is looked at for fraud. Watch this space.

Looks to be enough already as a starting point. Shouldn't take too long for Goddard to find the fraud now that he has the experience and I believe has been motivated enough to find it.

GHCN fraud in google will get your taste buds watering in anticipation for more to come.

I like this one as a starting point just for ammusment

GHCN Antarctic, 8X Actual Trend – Uses Single Warmest Station
http://noconsensus.wordpress.com/2009/12/13/ghcn-antarctic-warming-eight-times-actual/

I can remember Goddard starting out with little tid bits like these, until he figured out how to crack the nut and expose the fraud.

I look forward to it.

Data Tampering: GISS Caught Red-Handed Manipulating Data To Produce Arctic Climate History Revision
http://notrickszone.com/2012/03/01/data-tamperin-giss-caught-red-handed-manipulaing-data-to-produce-arctic-climate-history-revision/


At least it did in Australia, where Willis Eschenbach took a look at the raw data to determine what effect the “homogenization” process at the NOAA’s Global Historical Climate Network had on the temperature readings. Like alchemists of old, it transformed decades-long declines in temperature into rapid upward spikes completely unsupported by any of the underlying data
http://hotair.com/archives/2009/12/09/east-anglia-homogenization-falsified-declines-into-increases/

GHCN for ya


Looks like your on to a winner with this GHCN data there MOTR

;D ;D ;D ;D ;D

Title: Re: Temperature data manipulation exposed
Post by MOTR on Jul 2nd, 2014 at 8:22am
I guess BOM must be in on the conspiracy as well, progs.


http://www.bom.gov.au/cgi-bin/climate/hqsites/site_data.cgi?variable=meanT&area=nt&station=014015&dtype=anom&period=annual&ave_yr=11

Site information
Site name: Darwin
Site number: 014015
Latitude: 12.42°S   Longitude: 130.89°E
Operational status: Open
Nearest alternative sites
014825   Victoria River Downs (443 km)
001019   Kalumburu (504 km)
002012   Halls Creek (733 km)

Title: Re: Temperature data manipulation exposed
Post by lee on Jul 2nd, 2014 at 9:58am

MOTR wrote on Jul 1st, 2014 at 5:33pm:
Have another look at the y axis, lee, it's global.


Have a look at the sites I posted - US Government. They have changed the data if you look at the links.

So if NOOA have to adjust their temperatures and if BOM uses the same algorithm that requires NOOA to adjust its data; what do you think should be happening to Australia's historical data?

Does it then matter if the graph shows Global, if the algorithm for each local data set, from which the global figure is derived, shows errors in the data set?

And sorry you can't use the Darwin data set. The site has moved and there are no corrections available.

For other info on Darwin-

http://www.warwickhughes.com/agri/darwinfiddle25jun12.pdf

http://www.warwickhughes.com/blog/?p=302

BOM can't even hide behind the Glaisher Screen strawman for its homogenisation of Darwin records.

Title: Re: Temperature data manipulation exposed
Post by progressiveslol on Jul 2nd, 2014 at 9:57pm

lee wrote on Jul 2nd, 2014 at 9:58am:

MOTR wrote on Jul 1st, 2014 at 5:33pm:
Have another look at the y axis, lee, it's global.


Have a look at the sites I posted - US Government. They have changed the data if you look at the links.

So if NOOA have to adjust their temperatures and if BOM uses the same algorithm that requires NOOA to adjust its data; what do you think should be happening to Australia's historical data?

Does it then matter if the graph shows Global, if the algorithm for each local data set, from which the global figure is derived, shows errors in the data set?

And sorry you can't use the Darwin data set. The site has moved and there are no corrections available.

For other info on Darwin-

http://www.warwickhughes.com/agri/darwinfiddle25jun12.pdf

http://www.warwickhughes.com/blog/?p=302

BOM can't even hide behind the Glaisher Screen strawman for its homogenisation of Darwin records.

Its all a sick mess of cool the past and warm the present, with or without raw data.

Title: Re: Temperature data manipulation exposed
Post by austranger on Jul 2nd, 2014 at 10:40pm


Gotta just LOVE these conspiracy nuts, don't ya?


Title: Re: Temperature data manipulation exposed
Post by MOTR on Jul 3rd, 2014 at 8:40am

lee wrote on Jul 2nd, 2014 at 9:58am:

MOTR wrote on Jul 1st, 2014 at 5:33pm:
Have another look at the y axis, lee, it's global.


Have a look at the sites I posted - US Government. They have changed the data if you look at the links.

So if NOOA have to adjust their temperatures and if BOM uses the same algorithm that requires NOOA to adjust its data; what do you think should be happening to Australia's historical data?

Does it then matter if the graph shows Global, if the algorithm for each local data set, from which the global figure is derived, shows errors in the data set?

And sorry you can't use the Darwin data set. The site has moved and there are no corrections available.

For other info on Darwin-

http://www.warwickhughes.com/agri/darwinfiddle25jun12.pdf

http://www.warwickhughes.com/blog/?p=302

BOM can't even hide behind the Glaisher Screen strawman for its homogenisation of Darwin records.


You're missing the point, lee. If you don't like the adjusted data use the raw data.


At a global scale you can clearly see the adjusted and raw versions of the GHCN data are not substantially different. But you don't want to focus on the overall picture, you want to cherry pick the sites that show a warming adjustment you don't like.


Title: Re: Temperature data manipulation exposed
Post by The Stunt-free Horse on Jul 3rd, 2014 at 8:43am

progressiveslol wrote on Jul 2nd, 2014 at 9:57pm:

lee wrote on Jul 2nd, 2014 at 9:58am:

MOTR wrote on Jul 1st, 2014 at 5:33pm:
Have another look at the y axis, lee, it's global.


Have a look at the sites I posted - US Government. They have changed the data if you look at the links.

So if NOOA have to adjust their temperatures and if BOM uses the same algorithm that requires NOOA to adjust its data; what do you think should be happening to Australia's historical data?

Does it then matter if the graph shows Global, if the algorithm for each local data set, from which the global figure is derived, shows errors in the data set?

And sorry you can't use the Darwin data set. The site has moved and there are no corrections available.

For other info on Darwin-

http://www.warwickhughes.com/agri/darwinfiddle25jun12.pdf

http://www.warwickhughes.com/blog/?p=302

BOM can't even hide behind the Glaisher Screen strawman for its homogenisation of Darwin records.

Its all a sick mess of cool the past and warm the present, with or without raw data.

vote 1 copper internet in the asian century today  ::) :-[ :-[ :-[ :-[ :-[

Title: Re: Temperature data manipulation exposed
Post by lee on Jul 3rd, 2014 at 11:27am

MOTR wrote on Jul 3rd, 2014 at 8:40am:
You're missing the point, lee. If you don't like the adjusted data use the raw data.


You are missing the point even their RAW data has zombie stations that are deleted but still being credited with data.

And yesterday they were talking about how NCDC State of the Climate for the various cities in the States was giving the same values for TMax, Tmin and Tavg.

You have gotta love that. Historical (hysterical?) data is now seamlessly homogenised across all data sets.

Title: Re: Temperature data manipulation exposed
Post by progressiveslol on Jul 4th, 2014 at 12:51am
GISS asks itself.... Do you think anyone will notice


I don't think we should release this graph


Title: Re: Temperature data manipulation exposed
Post by MOTR on Jul 4th, 2014 at 9:01am

lee wrote on Jul 3rd, 2014 at 11:27am:

MOTR wrote on Jul 3rd, 2014 at 8:40am:
You're missing the point, lee. If you don't like the adjusted data use the raw data.


You are missing the point even their RAW data has zombie stations that are deleted but still being credited with data.

And yesterday they were talking about how NCDC State of the Climate for the various cities in the States was giving the same values for TMax, Tmin and Tavg.

You have gotta love that. Historical (hysterical?) data is now seamlessly homogenised across all data sets.


Infilling is one of the adjustments we are talking about.

Title: Re: Temperature data manipulation exposed
Post by lee on Jul 4th, 2014 at 11:36am

MOTR wrote on Jul 4th, 2014 at 9:01am:
Infilling is one of the adjustments we are talking about.


So we take some readings from 10, 20 or more kilometres away, average them and then some how we have data.

When the temperature1 km away, radially, can be different from here, how can that be interpreted as being the temperature.

Why not simply drop those stations not reporting,drop zombie stations. The pundits say if they did that there would be little difference. The question then is why do they do it?

Title: Re: Temperature data manipulation exposed
Post by MOTR on Jul 4th, 2014 at 1:28pm

lee wrote on Jul 4th, 2014 at 11:36am:

MOTR wrote on Jul 4th, 2014 at 9:01am:
Infilling is one of the adjustments we are talking about.


So we take some readings from 10, 20 or more kilometres away, average them and then some how we have data.

When the temperature1 km away, radially, can be different from here, how can that be interpreted as being the temperature.

Why not simply drop those stations not reporting,drop zombie stations. The pundits say if they did that there would be little difference. The question then is why do they do it?


They do it to because they attempt to provide an  average temperature for the US in absolute terms, not an anomaly. It does this by ensuring every month has an average for each of its 1218 stations. In an ideal world these stations never change. Unfortunately, stations do become defunct overtime, so USHCN infill by providing an estimate from neighbouring stations.


Title: Re: Temperature data manipulation exposed
Post by lee on Jul 4th, 2014 at 3:21pm

MOTR wrote on Jul 4th, 2014 at 1:28pm:
They do it to because they attempt to provide an  average temperature for the US in absolute terms, not an anomaly. It does this by ensuring every month has an average for each of its 1218 stations. In an ideal world these stations never change. Unfortunately, stations do become defunct overtime, so USHCN infill by providing an estimate from neighbouring stations.


But that doesn't explain why they do it if merely dropping them would apparently make little difference. It also is a construct, it is not a measurement and it is not data.

Title: Re: Temperature data manipulation exposed
Post by MOTR on Jul 4th, 2014 at 3:36pm

lee wrote on Jul 4th, 2014 at 3:21pm:

MOTR wrote on Jul 4th, 2014 at 1:28pm:
They do it to because they attempt to provide an  average temperature for the US in absolute terms, not an anomaly. It does this by ensuring every month has an average for each of its 1218 stations. In an ideal world these stations never change. Unfortunately, stations do become defunct overtime, so USHCN infill by providing an estimate from neighbouring stations.


But that doesn't explain why they do it if merely dropping them would apparently make little difference. It also is a construct, it is not a measurement and it is not data.


What happens if you drop a station from Alaska? If you remove all the data from that station you are going to end up with a higher average temperature.

Title: Re: Temperature data manipulation exposed
Post by progressiveslol on Jul 4th, 2014 at 3:46pm
Does this look like what is happening with the climate data. You bet. Do you know where this came from. Yep, this is 1984


“Winston Smith works as a clerk in the Records Department of the Ministry of Truth, where his job is to rewrite historical documents so they match the constantly changing current party line.”

Title: Re: Temperature data manipulation exposed
Post by greggerypeccary on Jul 4th, 2014 at 3:55pm

progressiveslol wrote on Jul 4th, 2014 at 3:46pm:
Does this look like what is happening with the climate data. You bet. Do you know where this came from. Yep, this is 1984


“Winston Smith works as a clerk in the Records Department of the Ministry of Truth, where his job is to rewrite historical documents so they match the constantly changing current party line.”


"Does this look like what is happening with the climate data?"

Yes.  Absolutely.

Title: Re: Temperature data manipulation exposed
Post by MOTR on Jul 4th, 2014 at 4:32pm

greggerypeccary wrote on Jul 4th, 2014 at 3:55pm:

progressiveslol wrote on Jul 4th, 2014 at 3:46pm:
Does this look like what is happening with the climate data. You bet. Do you know where this came from. Yep, this is 1984


“Winston Smith works as a clerk in the Records Department of the Ministry of Truth, where his job is to rewrite historical documents so they match the constantly changing current party line.”


"Does this look like what is happening with the climate data?"

Yes.  Absolutely.


For what purpose, greggery? And where is your evidence?

Are you seriously arguing data shouldn't be adjusted to take into account known biases.

You are sounding more and more like an ideological nutter.


How about you do a little reading into the biases that exist in the raw data.

http://www.ncdc.noaa.gov/oa/climate/research/ushcn/ushcn.html

Title: Re: Temperature data manipulation exposed
Post by greggerypeccary on Jul 4th, 2014 at 4:43pm

MOTR wrote on Jul 4th, 2014 at 4:32pm:

greggerypeccary wrote on Jul 4th, 2014 at 3:55pm:

progressiveslol wrote on Jul 4th, 2014 at 3:46pm:
Does this look like what is happening with the climate data. You bet. Do you know where this came from. Yep, this is 1984


“Winston Smith works as a clerk in the Records Department of the Ministry of Truth, where his job is to rewrite historical documents so they match the constantly changing current party line.”


"Does this look like what is happening with the climate data?"

Yes.  Absolutely.


And where is your evidence?


http://www.ncdc.noaa.gov/oa/climate/research/ushcn/ushcn.html

Title: Re: Temperature data manipulation exposed
Post by MOTR on Jul 4th, 2014 at 4:51pm

greggerypeccary wrote on Jul 4th, 2014 at 4:43pm:

MOTR wrote on Jul 4th, 2014 at 4:32pm:

greggerypeccary wrote on Jul 4th, 2014 at 3:55pm:

progressiveslol wrote on Jul 4th, 2014 at 3:46pm:
Does this look like what is happening with the climate data. You bet. Do you know where this came from. Yep, this is 1984


“Winston Smith works as a clerk in the Records Department of the Ministry of Truth, where his job is to rewrite historical documents so they match the constantly changing current party line.”


"Does this look like what is happening with the climate data?"

Yes.  Absolutely.


And where is your evidence?


http://www.ncdc.noaa.gov/oa/climate/research/ushcn/ushcn.html


So you are suggesting known biases should be ignored.

That's going to work well isn't it. No wonder you don't get the scientific literature.

Title: Re: Temperature data manipulation exposed
Post by greggerypeccary on Jul 4th, 2014 at 4:53pm

MOTR wrote on Jul 4th, 2014 at 4:32pm:
You are sounding more and more like an ideological nutter.


This, coming from someone who pulled "less than 1%" out of thin air (or perhaps it's thick, with CO2).

Someone who also thinks that 134 years of temperature records is enough to understand the planet's 4.5 billion year history.

You'll forgive me if I don't take your criticism seriously.


Title: Re: Temperature data manipulation exposed
Post by MOTR on Jul 4th, 2014 at 5:02pm

greggerypeccary wrote on Jul 4th, 2014 at 4:53pm:

MOTR wrote on Jul 4th, 2014 at 4:32pm:
You are sounding more and more like an ideological nutter.


This, coming from someone who pulled "less than 1%" out of thin air (or perhaps it's thick, with CO2).

Someone who also thinks that 134 years of temperature records is enough to understand the planet's 4.5 billion year history.

You'll forgive me if I don't take your criticism seriously.


We were in the processes of discussing why I believe there is a less than 1% chance that the climate change we are experiencing is not anthropogenic in nature.

I referred you to the last IPCC report, but you seem to think it was irrelevant.

The 2nd point I did not make, it is a strawman you've made up. I guess that's easier than having an honest debate.

How about you tell us why you believe there is some massive conspiracy going on.

Title: Re: Temperature data manipulation exposed
Post by greggerypeccary on Jul 4th, 2014 at 5:04pm

MOTR wrote on Jul 4th, 2014 at 5:02pm:

greggerypeccary wrote on Jul 4th, 2014 at 4:53pm:

MOTR wrote on Jul 4th, 2014 at 4:32pm:
You are sounding more and more like an ideological nutter.


This, coming from someone who pulled "less than 1%" out of thin air (or perhaps it's thick, with CO2).

Someone who also thinks that 134 years of temperature records is enough to understand the planet's 4.5 billion year history.

You'll forgive me if I don't take your criticism seriously.


We were in the processes of discussing why I believe there is a less than 1% chance that the climate change we are experiencing is not anthropogenic in nature.

I referred you to the last IPCC report, but you seem to think it was irrelevant.

The 2nd point I did not make, it is a strawman you've made up. I guess that's easier than having an honest debate.

How about you tell us why you believe there is some massive conspiracy going on.


Who mentioned a conspiracy?


Title: Re: Temperature data manipulation exposed
Post by MOTR on Jul 4th, 2014 at 5:11pm

greggerypeccary wrote on Jul 4th, 2014 at 5:04pm:

MOTR wrote on Jul 4th, 2014 at 5:02pm:

greggerypeccary wrote on Jul 4th, 2014 at 4:53pm:

MOTR wrote on Jul 4th, 2014 at 4:32pm:
You are sounding more and more like an ideological nutter.


This, coming from someone who pulled "less than 1%" out of thin air (or perhaps it's thick, with CO2).

Someone who also thinks that 134 years of temperature records is enough to understand the planet's 4.5 billion year history.

You'll forgive me if I don't take your criticism seriously.


We were in the processes of discussing why I believe there is a less than 1% chance that the climate change we are experiencing is not anthropogenic in nature.

I referred you to the last IPCC report, but you seem to think it was irrelevant.

The 2nd point I did not make, it is a strawman you've made up. I guess that's easier than having an honest debate.

How about you tell us why you believe there is some massive conspiracy going on.


Who mentioned a conspiracy?


If you want to draw analogies between the ministry of truth and scientists adjusting raw data to remove known biases, who needs to actually use the word conspiracy, but we all know what you are implying.

So how about rather than playing word games you identify the adjustments you feel are unnecessary.


Title: Re: Temperature data manipulation exposed
Post by greggerypeccary on Jul 4th, 2014 at 5:12pm

MOTR wrote on Jul 4th, 2014 at 5:02pm:

greggerypeccary wrote on Jul 4th, 2014 at 4:53pm:

MOTR wrote on Jul 4th, 2014 at 4:32pm:
You are sounding more and more like an ideological nutter.


This, coming from someone who pulled "less than 1%" out of thin air (or perhaps it's thick, with CO2).

Someone who also thinks that 134 years of temperature records is enough to understand the planet's 4.5 billion year history.

You'll forgive me if I don't take your criticism seriously.


We were in the processes of discussing why I believe there is a less than 1% chance that the climate change we are experiencing is not anthropogenic in nature.

I referred you to the last IPCC report, but you seem to think it was irrelevant.


I don't remember it saying "the chance of the current warming being a natural variation somewhere in the vicinity of less than 1%."

It seems to be an arbitrary figure that you've made up in order to try and make your argument look a little better.


Title: Re: Temperature data manipulation exposed
Post by MOTR on Jul 4th, 2014 at 5:18pm

greggerypeccary wrote on Jul 4th, 2014 at 5:12pm:

MOTR wrote on Jul 4th, 2014 at 5:02pm:

greggerypeccary wrote on Jul 4th, 2014 at 4:53pm:

MOTR wrote on Jul 4th, 2014 at 4:32pm:
You are sounding more and more like an ideological nutter.


This, coming from someone who pulled "less than 1%" out of thin air (or perhaps it's thick, with CO2).

Someone who also thinks that 134 years of temperature records is enough to understand the planet's 4.5 billion year history.

You'll forgive me if I don't take your criticism seriously.


We were in the processes of discussing why I believe there is a less than 1% chance that the climate change we are experiencing is not anthropogenic in nature.

I referred you to the last IPCC report, but you seem to think it was irrelevant.


I don't remember it saying "the chance of the current warming being a natural variation somewhere in the vicinity of less than 1%."

It seems to be an arbitrary figure that you've made up in order to try and make your argument look a little better.


You do understand virtually certain means greater than 99%.


Quote:
“there is consistent evidence from observations of a net energy uptake of the earth system due to an imbalance in the energy budget.”

“It is virtually certain that this is caused by human activities, primarily by the increase in CO2 concentrations. There is very high confidence that natural forcing contributes only a small fraction to this imbalance.”

Title: Re: Temperature data manipulation exposed
Post by greggerypeccary on Jul 4th, 2014 at 5:22pm

MOTR wrote on Jul 4th, 2014 at 5:11pm:

greggerypeccary wrote on Jul 4th, 2014 at 5:04pm:

MOTR wrote on Jul 4th, 2014 at 5:02pm:

greggerypeccary wrote on Jul 4th, 2014 at 4:53pm:

MOTR wrote on Jul 4th, 2014 at 4:32pm:
You are sounding more and more like an ideological nutter.


This, coming from someone who pulled "less than 1%" out of thin air (or perhaps it's thick, with CO2).

Someone who also thinks that 134 years of temperature records is enough to understand the planet's 4.5 billion year history.

You'll forgive me if I don't take your criticism seriously.


We were in the processes of discussing why I believe there is a less than 1% chance that the climate change we are experiencing is not anthropogenic in nature.

I referred you to the last IPCC report, but you seem to think it was irrelevant.

The 2nd point I did not make, it is a strawman you've made up. I guess that's easier than having an honest debate.

How about you tell us why you believe there is some massive conspiracy going on.


Who mentioned a conspiracy?


... but we all know what you are implying.


I can come right out and say it, if you like.

Anyone who believes "there is a less than 1% chance that the climate change we are experiencing is not anthropogenic in nature", when they have already admitted that we only have temperature records going back to 1880, sounds like "an ideological nutter" to me.

Probably sounds that way to a lot of other people too.

Title: Re: Temperature data manipulation exposed
Post by lee on Jul 4th, 2014 at 5:42pm

MOTR wrote on Jul 4th, 2014 at 3:36pm:
What happens if you drop a station from Alaska? If you remove all the data from that station you are going to end up with a higher average temperature


Would it matter?

'Gavin Schmidt

    Global weather services gather far more data than we need. To get the structure of the monthly or yearly anomalies over the United States, for example, you’d just need a handful of stations, but there are actually some 1,100 of them. You could throw out 50 percent of the station data or more, and you’d get basically the same answers. Individual stations do get old and break down, since they’re exposed to the elements, but this is just one of things that the NOAA has to deal with. One recent innovation is the set up of a climate reference network alongside the current stations so that they can look for potentially serious issues at the large scale—and they haven’t found any yet.'

http://earthobservatory.nasa.gov/Features/Interviews/schmidt_20100122.php

Title: Re: Temperature data manipulation exposed
Post by MOTR on Jul 4th, 2014 at 5:48pm
I'm not interested in what it sounds like. You asked me for my position and I gave it to you. I can't think of a single natural forcing that can explain the current rise in global temperatures. We know the physical properties of CO2 and other greenhouse gasses and our satellites can measure their effect. We can see that CO2, along with ozone (O3) and methane (CH4) are having a warming effect. We also have a very good handle on the other usual suspects and they simply are not in play at the moment.

As I stated I'm virtually certain it's us. If you think that sounds weird, it's more a reflection of your understating of the science than mine.


Title: Re: Temperature data manipulation exposed
Post by MOTR on Jul 4th, 2014 at 5:52pm

lee wrote on Jul 4th, 2014 at 5:42pm:

MOTR wrote on Jul 4th, 2014 at 3:36pm:
What happens if you drop a station from Alaska? If you remove all the data from that station you are going to end up with a higher average temperature


Would it matter?

'Gavin Schmidt

    Global weather services gather far more data than we need. To get the structure of the monthly or yearly anomalies over the United States, for example, you’d just need a handful of stations, but there are actually some 1,100 of them. You could throw out 50 percent of the station data or more, and you’d get basically the same answers. Individual stations do get old and break down, since they’re exposed to the elements, but this is just one of things that the NOAA has to deal with. One recent innovation is the set up of a climate reference network alongside the current stations so that they can look for potentially serious issues at the large scale—and they haven’t found any yet.'

http://earthobservatory.nasa.gov/Features/Interviews/schmidt_20100122.php


The key word in your quote is anomalies.

USHCN is endeavouring to come up with an absolute value. If you lose a number of stations in either hot or cold climates this will impact on absolute values.

Title: Re: Temperature data manipulation exposed
Post by greggerypeccary on Jul 4th, 2014 at 5:58pm

MOTR wrote on Jul 4th, 2014 at 5:48pm:
I'm not interested in what it sounds like.


Just repeating your lines, once again.

"You are sounding more and more like an ideological nutter."

Considering I have an open mind on the subject and you, on the other hand, are "virtually certain" that you're right, I find your statement quite ironic.

Title: Re: Temperature data manipulation exposed
Post by lee on Jul 4th, 2014 at 5:59pm
'Ozone's impact on climate consists primarily of changes in temperature. The more ozone in a given parcel of air, the more heat it retains. Ozone generates heat in the stratosphere, both by absorbing the sun's ultraviolet radiation and by absorbing upwelling infrared radiation from the lower atmosphere (troposphere). '

http://www.giss.nasa.gov/research/features/200402_tango/

So far so good. But isn't ozone recovering from depletion - or was the hole merely a construct to frighten?

Title: Re: Temperature data manipulation exposed
Post by MOTR on Jul 4th, 2014 at 6:06pm

greggerypeccary wrote on Jul 4th, 2014 at 5:58pm:

MOTR wrote on Jul 4th, 2014 at 5:48pm:
I'm not interested in what it sounds like.


Just repeating your lines, once again.

"You are sounding more and more like an ideological nutter."

Considering I have an open mind on the subject and you, on the other hand, are "virtually certain" that you're right, I find your statement quite ironic.


Having an open mind and being virtually certain about something is not a contradiction.

Are you saying the scientists who contributed to the IPCC report don't have an open mind.


Quote:
The draft report, which was still undergoing a peer review process, said that “there is consistent evidence from observations of a net energy uptake of the earth system due to an imbalance in the energy budget.”

“It is virtually certain that this is caused by human activities, primarily by the increase in CO2 concentrations. There is very high confidence that natural forcing contributes only a small fraction to this imbalance.”


Title: Re: Temperature data manipulation exposed
Post by greggerypeccary on Jul 4th, 2014 at 6:22pm

MOTR wrote on Jul 4th, 2014 at 6:06pm:

greggerypeccary wrote on Jul 4th, 2014 at 5:58pm:

MOTR wrote on Jul 4th, 2014 at 5:48pm:
I'm not interested in what it sounds like.


Just repeating your lines, once again.

"You are sounding more and more like an ideological nutter."

Considering I have an open mind on the subject and you, on the other hand, are "virtually certain" that you're right, I find your statement quite ironic.


Having an open mind and being virtually certain about something is not a contradiction.

Are you saying the scientists who contributed to the IPCC report don't have an open mind.


I'm saying you don't have an open mind on the subject.

It's more than 99% closed.

Calling me "an ideological nutter" is quite laughable, considering you are the one blinded by ideology.


Title: Re: Temperature data manipulation exposed
Post by MOTR on Jul 4th, 2014 at 6:39pm

greggerypeccary wrote on Jul 4th, 2014 at 6:22pm:

MOTR wrote on Jul 4th, 2014 at 6:06pm:

greggerypeccary wrote on Jul 4th, 2014 at 5:58pm:

MOTR wrote on Jul 4th, 2014 at 5:48pm:
I'm not interested in what it sounds like.


Just repeating your lines, once again.

"You are sounding more and more like an ideological nutter."

Considering I have an open mind on the subject and you, on the other hand, are "virtually certain" that you're right, I find your statement quite ironic.


Having an open mind and being virtually certain about something is not a contradiction.

Are you saying the scientists who contributed to the IPCC report don't have an open mind.


I'm saying you don't have an open mind on the subject.

It's more than 99% closed.

Calling me "an ideological nutter" is quite laughable, considering you are the one blinded by ideology.


I'm convinced by the science. Science is not an ideology. If you have evidence that contradicts my position I will reassess my degree of certainty. The notion that being virtually certain about something excludes you from having an open mind is ridiculous.

To date you haven't provided anything that has forced me to reconsider my position. However, I will continue to look.

Now seeing this thread is about temperature data manipulation, do you have any reason to believe the data adjustments are fabrications rather than legitimate adjustments used to remove non-climate biases, such as a change in the time of observation, a loss of data, or a change in a measurement device.

Title: Re: Temperature data manipulation exposed
Post by lee on Jul 4th, 2014 at 7:12pm
What is the science in ECS?

Title: Re: Temperature data manipulation exposed
Post by greggerypeccary on Jul 4th, 2014 at 7:45pm

MOTR wrote on Jul 4th, 2014 at 6:39pm:
The notion that being virtually certain about something excludes you from having an open mind is ridiculous.


You are virtually certain, despite there only being records available from 1880.

That, my friend, is ridiculous.

In fact, you couldn't get more ridiculous if you tried.

Title: Re: Temperature data manipulation exposed
Post by progressiveslol on Jul 4th, 2014 at 7:51pm

lee wrote on Jul 4th, 2014 at 5:42pm:

MOTR wrote on Jul 4th, 2014 at 3:36pm:
What happens if you drop a station from Alaska? If you remove all the data from that station you are going to end up with a higher average temperature


Would it matter?

'Gavin Schmidt

    Global weather services gather far more data than we need. To get the structure of the monthly or yearly anomalies over the United States, for example, you’d just need a handful of stations, but there are actually some 1,100 of them. You could throw out 50 percent of the station data or more, and you’d get basically the same answers. Individual stations do get old and break down, since they’re exposed to the elements, but this is just one of things that the NOAA has to deal with. One recent innovation is the set up of a climate reference network alongside the current stations so that they can look for potentially serious issues at the large scale—and they haven’t found any yet.'

http://earthobservatory.nasa.gov/Features/Interviews/schmidt_20100122.php

Careful what you wish for. They have already gotten rid of some stations. The stations that show cooling or no change. The ministry of truth is at work in many ways.
http://www.ozpolitic.com/forum/YaBB.pl?num=1344392462/122#122

Title: Re: Temperature data manipulation exposed
Post by MOTR on Jul 4th, 2014 at 7:59pm

progressiveslol wrote on Jul 4th, 2014 at 7:51pm:

lee wrote on Jul 4th, 2014 at 5:42pm:

MOTR wrote on Jul 4th, 2014 at 3:36pm:
What happens if you drop a station from Alaska? If you remove all the data from that station you are going to end up with a higher average temperature


Would it matter?

'Gavin Schmidt

    Global weather services gather far more data than we need. To get the structure of the monthly or yearly anomalies over the United States, for example, you’d just need a handful of stations, but there are actually some 1,100 of them. You could throw out 50 percent of the station data or more, and you’d get basically the same answers. Individual stations do get old and break down, since they’re exposed to the elements, but this is just one of things that the NOAA has to deal with. One recent innovation is the set up of a climate reference network alongside the current stations so that they can look for potentially serious issues at the large scale—and they haven’t found any yet.'

http://earthobservatory.nasa.gov/Features/Interviews/schmidt_20100122.php

Careful what you wish for. They have already gotten rid of some stations. The stations that show cooling or no change. The ministry of truth is at work in many ways.
http://www.ozpolitic.com/forum/YaBB.pl?num=1344392462/122#122


Again, where is your evidence, progs. If you are going to throw about accusations such as this, how about you provide some details.

Title: Re: Temperature data manipulation exposed
Post by austranger on Jul 4th, 2014 at 8:08pm
This is pointless really.
There are two schools of thought, with minor exceptions.
Those who believe, and those who don't accept the science, the evidence and all the results of scientific method and experimentation/research.
If those unbelievers aren't willing to accept all that then no amount of logic will dissuade them, it's become a religious faith with them that brooks no contradiction.

Title: Re: Temperature data manipulation exposed
Post by greggerypeccary on Jul 4th, 2014 at 8:12pm

austranger wrote on Jul 4th, 2014 at 8:08pm:
This is pointless really.
There are two schools of thought, with minor exceptions.
Those who believe, and those who don't accept the science, the evidence and all the results of scientific method and experimentation/research.
If those unbelievers aren't willing to accept all that then no amount of logic will dissuade them, it's become a religious faith with them that brooks no contradiction.


Correct!

AGW is basically a faith based religion/cult.

I've been saying that for years.


Title: Re: Temperature data manipulation exposed
Post by The Stunt-free Horse on Jul 5th, 2014 at 4:09am

greggerypeccary wrote on Jul 4th, 2014 at 4:53pm:

MOTR wrote on Jul 4th, 2014 at 4:32pm:
You are sounding more and more like an ideological nutter.


This, coming from someone who pulled "less than 1%" out of thin air (or perhaps it's thick, with CO2).

Someone who also thinks that 134 years of temperature records is enough to understand the planet's 4.5 billion year history.

You'll forgive me if I don't take your criticism seriously.

RATES OF CHANGE-HERE WE GO AGAIN...  ::)

Title: Re: Temperature data manipulation exposed
Post by lee on Jul 5th, 2014 at 12:44pm

austranger wrote on Jul 4th, 2014 at 8:08pm:
Those who believe, and those who don't accept the science, the evidence and all the results of scientific method and experimentation/research.


The ECS is NOT science
The models are NOT science.
The models have a plethora of underlying assumptions. Unless all of those assumptions are correct the models are GIGO. Averaging a bunch of wrong models is not magically going to produce a correct outcome. It may come close if the split is about 50:50, but then the average may be correct for the wrong reasons.

Title: Re: Temperature data manipulation exposed
Post by lee on Jul 5th, 2014 at 12:50pm

BatteriesNotIncluded wrote on Jul 5th, 2014 at 4:09am:
RATES OF CHANGE-HERE WE GO AGAIN...


I posted a graph re rates of change yesterday. The graph was from the BBC. They wouldn't lie to us would they?

The IPCC says 30 years for Climate, shorter is weather. There are two 30 year periods in the graph.

If we are talking historical time frames over a thousand odd years those two periods would probably show as one. That would definitely be the case over an 11,000 year time frame unless you had a loooooong piece of paper.

Title: Re: Temperature data manipulation exposed
Post by greggerypeccary on Jul 5th, 2014 at 2:08pm

BatteriesNotIncluded wrote on Jul 5th, 2014 at 4:09am:

greggerypeccary wrote on Jul 4th, 2014 at 4:53pm:

MOTR wrote on Jul 4th, 2014 at 4:32pm:
You are sounding more and more like an ideological nutter.


This, coming from someone who pulled "less than 1%" out of thin air (or perhaps it's thick, with CO2).

Someone who also thinks that 134 years of temperature records is enough to understand the planet's 4.5 billion year history.

You'll forgive me if I don't take your criticism seriously.

RATES OF CHANGE-HERE WE GO AGAIN...  ::)


134 years of temperature records, DRAH.

Not good enough.

Title: Re: Temperature data manipulation exposed
Post by MOTR on Jul 6th, 2014 at 11:25pm

greggerypeccary wrote on Jul 5th, 2014 at 2:08pm:

BatteriesNotIncluded wrote on Jul 5th, 2014 at 4:09am:

greggerypeccary wrote on Jul 4th, 2014 at 4:53pm:

MOTR wrote on Jul 4th, 2014 at 4:32pm:
You are sounding more and more like an ideological nutter.


This, coming from someone who pulled "less than 1%" out of thin air (or perhaps it's thick, with CO2).

Someone who also thinks that 134 years of temperature records is enough to understand the planet's 4.5 billion year history.

You'll forgive me if I don't take your criticism seriously.

RATES OF CHANGE-HERE WE GO AGAIN...  ::)


134 years of temperature records, DRAH.

Not good enough.


What are you talking about, greggery. Are you saying there is absolutely nothing we can learn from paleo climatology.

What makes you so much more of an expert than the scientific community. You do realise there are no national or major scientific institutions anywhere in the world that dispute the theory of anthropogenic climate change. Not one.


Title: Re: Temperature data manipulation exposed
Post by The Stunt-free Horse on Jul 7th, 2014 at 12:09am

greggerypeccary wrote on Jul 5th, 2014 at 2:08pm:

BatteriesNotIncluded wrote on Jul 5th, 2014 at 4:09am:

greggerypeccary wrote on Jul 4th, 2014 at 4:53pm:

MOTR wrote on Jul 4th, 2014 at 4:32pm:
You are sounding more and more like an ideological nutter.


This, coming from someone who pulled "less than 1%" out of thin air (or perhaps it's thick, with CO2).

Someone who also thinks that 134 years of temperature records is enough to understand the planet's 4.5 billion year history.

You'll forgive me if I don't take your criticism seriously.

RATES OF CHANGE-HERE WE GO AGAIN...  ::)


134 years of temperature records, DRAH.

Not good enough.

What is not good enough? Be specific now- just pretend there's a jury or your schtick counts or whatever yous good blokes do when the job is apparently not a laughing matter!

  :D :D

But we all know you will be vague and try to convince us all black is white because FUD is all you were taught as a profession!

!! "..Play ball  :D :D :D :)"...

Title: Re: Temperature data manipulation exposed
Post by The Stunt-free Horse on Jul 7th, 2014 at 12:10am

greggerypeccary wrote on Jul 5th, 2014 at 2:08pm:

BatteriesNotIncluded wrote on Jul 5th, 2014 at 4:09am:

greggerypeccary wrote on Jul 4th, 2014 at 4:53pm:

MOTR wrote on Jul 4th, 2014 at 4:32pm:
You are sounding more and more like an ideological nutter.


This, coming from someone who pulled "less than 1%" out of thin air (or perhaps it's thick, with CO2).

Someone who also thinks that 134 years of temperature records is enough to understand the planet's 4.5 billion year history.

You'll forgive me if I don't take your criticism seriously.

RATES OF CHANGE-HERE WE GO AGAIN...  ::)


134 years of temperature records, DRAH.

Not good enough.

What is not good enough? Be specific now- just pretend there's a jury or your schtick counts or whatever yous good blokes do when the job is apparently not a laughing matter!

  :D :D

But we all know you will be vague and try to convince us all black is white because FUD is all you were taught as a profession!

!! "..Play ball  :D :D :D :)"...

Title: Re: Temperature data manipulation exposed
Post by The Stunt-free Horse on Jul 7th, 2014 at 12:14am

MOTR wrote on Jul 6th, 2014 at 11:25pm:

greggerypeccary wrote on Jul 5th, 2014 at 2:08pm:

BatteriesNotIncluded wrote on Jul 5th, 2014 at 4:09am:

greggerypeccary wrote on Jul 4th, 2014 at 4:53pm:

MOTR wrote on Jul 4th, 2014 at 4:32pm:
You are sounding more and more like an ideological nutter.


This, coming from someone who pulled "less than 1%" out of thin air (or perhaps it's thick, with CO2).

Someone who also thinks that 134 years of temperature records is enough to understand the planet's 4.5 billion year history.

You'll forgive me if I don't take your criticism seriously.

RATES OF CHANGE-HERE WE GO AGAIN...  ::)


134 years of temperature records, DRAH.

Not good enough.


What are you talking about, greggery. Are you saying there is absolutely nothing we can learn from paleo climatology.

What makes you so much more of an expert than the scientific community. You do realise there are no national or major scientific institutions anywhere in the world that dispute the theory ofou anthropogenic climate change. Not one.

NO NO, greg is just getting his jollies of by reminding us all that his professional training in the art of FUD makes him the ultimate and unjailable pedo and that there is nothing any of us can do about it!

Title: Re: Temperature data manipulation exposed
Post by progressiveslol on Jul 21st, 2014 at 7:13pm
Watch this space

Quick Summary Of NCDC Data Tampering Forensics

It may not be obvious to everyone yet, but this morning’s TOBS discovery is huge.

I need to run now, but here is a quick summary of things I can prove so far about the US temperature record.
◾Until 1999 NASA said the US was on a long term cooling trend
◾Until 1989 NOAA said there was no long term warming in the US
◾Sometime after 2000, NOAA made a large downwards shift in the absolute baseline temperature. This is probably why Nick and Zeke keep insisting on the use of anomalies, as it hides the shift.
◾Temperatures are being adjusted an average of about 1.5F relative to the 1930s
◾The raw data does not support the validity of a TOBS adjustment
◾NOAA is doing something in their conversion from daily data to monthly data to create a bias which selectively cools the past – which in turn creates the appearance that TOBS is valid.
Since 1990, almost all warming is due to infilling of non-existent temperature data.

And to top it all off, the UHI adjustment is much too small. The US is on a long term cooling trend for over 90 years, and used to be hotter. NCDC US temperature graphs do not even remotely resemble the actual US climate, and actually reverse the trend.

I will write this up in more detail later.

http://stevengoddard.wordpress.com/2014/07/20/quick-summary-of-ncdc-data-tampering-forensics/

Title: Re: Temperature data manipulation exposed
Post by greggerypeccary on Jul 21st, 2014 at 7:21pm

BatteriesNotIncluded wrote on Jul 7th, 2014 at 12:14am:

MOTR wrote on Jul 6th, 2014 at 11:25pm:

greggerypeccary wrote on Jul 5th, 2014 at 2:08pm:

BatteriesNotIncluded wrote on Jul 5th, 2014 at 4:09am:

greggerypeccary wrote on Jul 4th, 2014 at 4:53pm:

MOTR wrote on Jul 4th, 2014 at 4:32pm:
You are sounding more and more like an ideological nutter.


This, coming from someone who pulled "less than 1%" out of thin air (or perhaps it's thick, with CO2).

Someone who also thinks that 134 years of temperature records is enough to understand the planet's 4.5 billion year history.

You'll forgive me if I don't take your criticism seriously.

RATES OF CHANGE-HERE WE GO AGAIN...  ::)


134 years of temperature records, DRAH.

Not good enough.


What are you talking about, greggery. Are you saying there is absolutely nothing we can learn from paleo climatology.

What makes you so much more of an expert than the scientific community. You do realise there are no national or major scientific institutions anywhere in the world that dispute the theory ofou anthropogenic climate change. Not one.

NO NO, greg is just getting his jollies of by reminding us all that his professional training in the art of FUD makes him the ultimate and unjailable pedo and that there is nothing any of us can do about it!


Take a look at what these alarmists resort to:

" ... unjailable pedo ... "

Calling other forum members "pedos", just because they show some skepticism towards the AGW theory.

Mods, take note.  We don't need people like this in the forum (or our community).

Title: Re: Temperature data manipulation exposed
Post by greggerypeccary on Jul 21st, 2014 at 7:23pm

MOTR wrote on Jul 6th, 2014 at 11:25pm:

greggerypeccary wrote on Jul 5th, 2014 at 2:08pm:

BatteriesNotIncluded wrote on Jul 5th, 2014 at 4:09am:

greggerypeccary wrote on Jul 4th, 2014 at 4:53pm:

MOTR wrote on Jul 4th, 2014 at 4:32pm:
You are sounding more and more like an ideological nutter.


This, coming from someone who pulled "less than 1%" out of thin air (or perhaps it's thick, with CO2).

Someone who also thinks that 134 years of temperature records is enough to understand the planet's 4.5 billion year history.

You'll forgive me if I don't take your criticism seriously.

RATES OF CHANGE-HERE WE GO AGAIN...  ::)


134 years of temperature records, DRAH.

Not good enough.


What are you talking about, greggery. Are you saying there is absolutely nothing we can learn from paleo climatology.

What makes you so much more of an expert than the scientific community. You do realise there are no national or major scientific institutions anywhere in the world that dispute the theory of anthropogenic climate change. Not one.


This is what I'm saying:

134 years of temperature records, DRAH. Not good enough.

Which bit are you struggling to understand?


Title: Re: Temperature data manipulation exposed
Post by progressiveslol on Jul 21st, 2014 at 7:41pm

progressiveslol wrote on Jul 21st, 2014 at 7:13pm:
Watch this space

Quick Summary Of NCDC Data Tampering Forensics

It may not be obvious to everyone yet, but this morning’s TOBS discovery is huge.

I need to run now, but here is a quick summary of things I can prove so far about the US temperature record.
◾Until 1999 NASA said the US was on a long term cooling trend
◾Until 1989 NOAA said there was no long term warming in the US
◾Sometime after 2000, NOAA made a large downwards shift in the absolute baseline temperature. This is probably why Nick and Zeke keep insisting on the use of anomalies, as it hides the shift.
◾Temperatures are being adjusted an average of about 1.5F relative to the 1930s
◾The raw data does not support the validity of a TOBS adjustment
◾NOAA is doing something in their conversion from daily data to monthly data to create a bias which selectively cools the past – which in turn creates the appearance that TOBS is valid.
Since 1990, almost all warming is due to infilling of non-existent temperature data.

And to top it all off, the UHI adjustment is much too small. The US is on a long term cooling trend for over 90 years, and used to be hotter. NCDC US temperature graphs do not even remotely resemble the actual US climate, and actually reverse the trend.

I will write this up in more detail later.

http://stevengoddard.wordpress.com/2014/07/20/quick-summary-of-ncdc-data-tampering-forensics/

BOM temps don't make sense. Well they do, there is a word for it. You know the word. You know whats going on here. You are not that stupid.

Wow, look at those BOM adjustments – trends up by two degrees C!

Carnarvon adjustments don’t make sense


http://joannenova.com.au/2014/07/wow-look-at-those-bom-adjustments-trends-up-by-two-degrees-c/

Title: Re: Temperature data manipulation exposed
Post by The Stunt-free Horse on Jul 22nd, 2014 at 11:57am
black is white: now give me a suit and a car without scratches!

  ;D ;D

Title: Re: Temperature data manipulation exposed
Post by The Stunt-free Horse on Jul 22nd, 2014 at 11:57am
black is white: now give me a suit and a car without scratches!

  ;D ;D

Title: Re: Temperature data manipulation exposed
Post by progressiveslol on Aug 6th, 2014 at 7:27am
The end game, the holy grail of why the data temps are adjusted the way they are

Adjusting temperatures in correlation with co2 rise. Co2 rises and temperature follows

Oops, correlation that is too convenient to be ignored


http://stevengoddard.wordpress.com/2014/08/03/proof-that-us-warming-is-mann-made-part-2

Title: Re: Temperature data manipulation exposed
Post by progressiveslol on Aug 24th, 2014 at 7:09am
Hello Australian BOM


Australian Met Office Accused Of Manipulating Temperature Records


The [Australian] Bureau of Meteorology has been accused of manipulating historic temperature records to fit a predetermined view of global warming. Researcher Jennifer Marohasy claims the adjusted records resemble “propaganda” rather than science. Dr Marohasy has analysed the raw data from dozens of locations across Australia and matched it against the new data used by BOM showing that temperatures were progressively warming. In many cases, Dr Marohasy said, temperature trends had changed from slight cooling to dramatic warming over 100 years. –Graham Lloyd, The Australian, 23 August 2014


The escalating row goes to heart of the climate change debate — in particular, whether computer models are better than real data and whether temperature records are being manipulated in a bid to make each year hotter than the last. Marohasy’s research has put her in dispute with BoM over a paper she published with John Abbot at Central Queensland University in the journal Atmospheric Research concerning the best data to use for rainfall forecasting. BoM challenged the findings of the Marohasy-Abbot paper, but the international journal rejected the BoM rebuttal, which had been prepared by some of the bureau’s top scientists. This has led to an escalating dispute over the way in which ­Australia’s historical temperature records are “improved” through homogenisation, which is proving more difficult to resolve. –Graham Lloyd, The Australian, 23 August 2014

====================

One of the most extreme examples is a thermometer station in Amberley, Queensland where a cooling trend in minima of 1C per century has been homogenized and become a warming trend of 2.5C per century. This is a station at an airforce base that has no recorded move since 1941, nor had a change in instrumentation. It is a well-maintained site near a perimeter fence, yet the homogenisation process produces a remarkable transformation of the original records, and rather begs the question of how accurately we know Australian trends at all when the thermometers are seemingly so bad at recording the real temperature of an area. Ken Stewart was the first to notice this anomaly and many others when he compared the raw data to the new, adjusted ACORN data set.  Jennifer Marohasy picked it up, and investigated it and 30 or so other stations. In Rutherglen in Victoria, a cooling trend of -0.35C became a warming trend  of +1.73C. She raised her concerns (repeatedly) with Minister Greg Hunt.


more
http://wattsupwiththat.com/2014/08/23/australian-met-office-accused-of-manipulating-temperature-records/


Check out this guys raw data taken back in the day you could get it
http://www.addinall.net/climate/ausclimate/100yrural/

Title: Re: Temperature data manipulation exposed
Post by lee on Aug 24th, 2014 at 12:14pm
What I found interesting-

'One of the most extreme examples is a thermometer station in Amberley, Queensland where a cooling trend in minima of 1C per century has been homogenized and become a warming trend of 2.5C per century. This is a station at an airforce base that has no recorded move since 1941, nor had a change in instrumentation. It is a well-maintained site near a perimeter fence,

Title: Re: Temperature data manipulation exposed
Post by Rider on Aug 24th, 2014 at 3:05pm
Fiddling the books, fraud written large, destruction of raw data, these criminals should be thrown in gaol.

Title: Re: Temperature data manipulation exposed
Post by progressiveslol on Aug 26th, 2014 at 10:51pm
The Australian BUM explains


Here’s the BOM explanation:

“Amberley: the major adjustment is to minimum temperatures in 1980. There is very little available documentation for Amberley before the 1990s (possibly, as an RAAF base, earlier documentation may be contained in classified material) and this adjustment was identified through neighbour comparisons. The level of confidence in this adjustment is very high because of the size of the inhomogeneity and the large number of other stations in the region (high network density), which can be used as a reference. The most likely cause is a site move within the RAAF base.”

Translated:So the Amberley thermometer might have secretly moved (and that might be classified) but we are sure it shifted one way or the other. Even though we don’t know where it was before, or how much difference that makes, we can figure out what the thermometers should have been recording in 1941 because of other stations which are hundreds of kilometers away.


Oops
Even more strange is that the nearest ACORN station is Brisbane Aero, 50km away, which also shows a long term cooling trend. (Paul Homewood has some good graphs on that.) It seems other stations further away are better at recording Amberley temperatures than thermometers at either Amberley or Brisbane.


http://joannenova.com.au/2014/08/bom-finally-explains-cooling-changed-to-warming-trends-because-stations-might-have-moved/

Title: Re: Temperature data manipulation exposed
Post by The Stunt-free Horse on Aug 27th, 2014 at 12:22am

Title: Re: Temperature data manipulation exposed
Post by The Stunt-free Horse on Aug 27th, 2014 at 12:22am

Title: Re: Temperature data manipulation exposed
Post by progressiveslol on Aug 27th, 2014 at 7:33am
BOM temperature records now in question. Another temperature data record that cannot be relied on due to activism


Who’s going to be sacked for making-up global warming at Rutherglen?

HEADS need to start rolling at the Australian Bureau of Meteorology. The senior management have tried to cover-up serious tampering that has occurred with the temperatures at an experimental farm near Rutherglen in Victoria. Retired scientist Dr Bill Johnston used to run experiments there. He, and many others, can vouch for the fact that the weather station at Rutherglen, providing data to the Bureau of Meteorology since November 1912, has never been moved.

Senior management at the Bureau are claiming the weather station could have been moved in 1966 and/or 1974 and that this could be a justification for artificially dropping the temperatures by 1.8 degree Celsius back in 1913.

Surely its time for heads to roll!

more
http://jennifermarohasy.com/2014/08/whos-going-to-be-sacked-for-making-up-global-warming-at-rutherglen/

For MOTR
This cooling of past temperatures is a new trick* that the mainstream climate science community has endorsed over recent years to ensure next year is always hotter than last year – at least for Australia

Title: Re: Temperature data manipulation exposed
Post by progressiveslol on Mar 3rd, 2015 at 2:42am
The gig is almost up for this data fraud.

Expert team plans to examine 'adjusted’ temperature data


How did we know that 2014 was “the hottest year ever”? This was based entirely on surface temperature data originally compiled by the US Global Historical Climate Network (GHCN), but then translated into their own versions by the compilers of three of the five official temperature records. But as I explained in two previous articles, a growing number of experts across the world have been discovering that something very odd has been going on with these records. Again and again they found that, checking them against the raw data originally recorded by weather stations, this had then been comprehensively “adjusted”, almost invariably in the same direction.


Earlier data had been “adjusted” downwards, more recent data upwards, to show much more of a warming trend than the actual recorded temperatures justified. Often, as Paul Homewood demonstrated on his Notalotofpeopleknowthat blog – after checking many weather stations in South America and across the Arctic – a cooling trend over the past century had been transformed into a warming trend.

If the results confirm what has already been unearthed by Homewood and other analysts, from the US to New Zealand, this may indeed turn out to have been the greatest scandal in the history of science.

http://www.telegraph.co.uk/comment/11426889/Expert-team-plans-to-examine-adjusted-temperature-data.html

Yes indeed the greatest scandal in the history of science

Title: Re: Temperature data manipulation exposed
Post by The Outrage Bus on Mar 3rd, 2015 at 9:32am
My guess is Christopher Booker is writing this not from being a respected reasonable jouirno, but as someone who is basically anti-science.


Note that he also disputes passive smokings relationship with cancer as wells as asbestos role in health issues.

Title: Re: Temperature data manipulation exposed
Post by Copper-toned-stunt on Mar 3rd, 2015 at 11:36am

progressiveslol wrote on Mar 3rd, 2015 at 2:42am:
The gig is almost up for this data fraud.

Expert team plans to examine 'adjusted’ temperature data


How did we know that 2014 was “the hottest year ever”? This was based entirely on surface temperature data originally compiled by the US Global Historical Climate Network (GHCN), but then translated into their own versions by the compilers of three of the five official temperature records. But as I explained in two previous articles, a growing number of experts across the world have been discovering that something very odd has been going on with these records. Again and again they found that, checking them against the raw data originally recorded by weather stations, this had then been comprehensively “adjusted”, almost invariably in the same direction.


Earlier data had been “adjusted” downwards, more recent data upwards, to show much more of a warming trend than the actual recorded temperatures justified. Often, as Paul Homewood demonstrated on his Notalotofpeopleknowthat blog – after checking many weather stations in South America and across the Arctic – a cooling trend over the past century had been transformed into a warming trend.

If the results confirm what has already been unearthed by Homewood and other analysts, from the US to New Zealand, this may indeed turn out to have been the greatest scandal in the history of science.

http://www.telegraph.co.uk/comment/11426889/Expert-team-plans-to-examine-adjusted-temperature-data.html

Yes indeed the greatest scandal in the history of science

LOOKOUT FOR THE DIVESTMENT CAMPAIGN  ;) ;)

Title: Re: Temperature data manipulation exposed
Post by progressiveslol on Mar 3rd, 2015 at 6:55pm

Prime Minister for Canyons wrote on Mar 3rd, 2015 at 9:32am:
My guess is Christopher Booker is writing this not from being a respected reasonable jouirno, but as someone who is basically anti-science.


Note that he also disputes passive smokings relationship with cancer as wells as asbestos role in health issues.

Is that the best ya got.

Try to keep up. Yes indeed, this will be the greatest scandal in the history of science

Title: Re: Temperature data manipulation exposed
Post by BachToTheFuture on Mar 3rd, 2015 at 7:11pm

progressiveslol wrote on Mar 3rd, 2015 at 6:55pm:

Prime Minister for Canyons wrote on Mar 3rd, 2015 at 9:32am:
My guess is Christopher Booker is writing this not from being a respected reasonable jouirno, but as someone who is basically anti-science.


Note that he also disputes passive smokings relationship with cancer as wells as asbestos role in health issues.

Is that the best ya got.

Try to keep up. Yes indeed, this will be the greatest scandal in the history of science


Almost as great as the evolution scandal. Almost.

Title: Re: Temperature data manipulation exposed
Post by progressiveslol on Mar 3rd, 2015 at 7:22pm

MumboJumbo wrote on Mar 3rd, 2015 at 7:11pm:

progressiveslol wrote on Mar 3rd, 2015 at 6:55pm:

Prime Minister for Canyons wrote on Mar 3rd, 2015 at 9:32am:
My guess is Christopher Booker is writing this not from being a respected reasonable jouirno, but as someone who is basically anti-science.


Note that he also disputes passive smokings relationship with cancer as wells as asbestos role in health issues.

Is that the best ya got.

Try to keep up. Yes indeed, this will be the greatest scandal in the history of science


Almost as great as the evolution scandal. Almost.

You may want to aim a little higher. No.. keep goin, no a little higher.

Evolution is not dead, AGW pseudo science will be.

Although I give you credit for putting the pseudo science of AGW on par with the science of evolution.

Title: Re: Temperature data manipulation exposed
Post by The Outrage Bus on Mar 3rd, 2015 at 8:37pm

progressiveslol wrote on Mar 3rd, 2015 at 6:55pm:

Prime Minister for Canyons wrote on Mar 3rd, 2015 at 9:32am:
My guess is Christopher Booker is writing this not from being a respected reasonable jouirno, but as someone who is basically anti-science.


Note that he also disputes passive smokings relationship with cancer as wells as asbestos role in health issues.

Is that the best ya got.

Try to keep up. Yes indeed, this will be the greatest scandal in the history of science


Well admittedly finding bias in an author who says its all a scam is pretty good ;)

Title: Re: Temperature data manipulation exposed
Post by Copper-toned-stunt on Mar 3rd, 2015 at 8:58pm

progressiveslol wrote on Mar 3rd, 2015 at 6:55pm:

Prime Minister for Canyons wrote on Mar 3rd, 2015 at 9:32am:
My guess is Christopher Booker is writing this not from being a respected reasonable jouirno, but as someone who is basically anti-science.


Note that he also disputes passive smokings relationship with cancer as wells as asbestos role in health issues.

Is that the best ya got.

Try to keep up. Yes indeed, this will be the greatest scandal in the history of science

!! ...indeed, because some child hating troll said so  ;D

Title: Re: Temperature data manipulation exposed
Post by Copper-toned-stunt on Mar 3rd, 2015 at 9:01pm

Prime Minister for Canyons wrote on Mar 3rd, 2015 at 8:37pm:

progressiveslol wrote on Mar 3rd, 2015 at 6:55pm:

Prime Minister for Canyons wrote on Mar 3rd, 2015 at 9:32am:
My guess is Christopher Booker is writing this not from being a respected reasonable jouirno, but as someone who is basically anti-science.


Note that he also disputes passive smokings relationship with cancer as wells as asbestos role in health issues.

Is that the best ya got.

Try to keep up. Yes indeed, this will be the greatest scandal in the history of science


Well admittedly finding bias in an author who says its all a scam is pretty good ;)

progslol IS THAT AUTHOR  :D :D

Title: Re: Temperature data manipulation exposed
Post by progressiveslol on Mar 3rd, 2015 at 9:13pm

Prime Minister for Canyons wrote on Mar 3rd, 2015 at 8:37pm:

progressiveslol wrote on Mar 3rd, 2015 at 6:55pm:

Prime Minister for Canyons wrote on Mar 3rd, 2015 at 9:32am:
My guess is Christopher Booker is writing this not from being a respected reasonable jouirno, but as someone who is basically anti-science.


Note that he also disputes passive smokings relationship with cancer as wells as asbestos role in health issues.

Is that the best ya got.

Try to keep up. Yes indeed, this will be the greatest scandal in the history of science


Well admittedly finding bias in an author who says its all a scam is pretty good ;)

It is not about the author, it is about the content of this thread. It is the out and out fraud of cool the past and warm the present.

Title: Re: Temperature data manipulation exposed
Post by Copper-toned-stunt on Mar 3rd, 2015 at 9:18pm

progressiveslol wrote on Mar 3rd, 2015 at 9:13pm:

Prime Minister for Canyons wrote on Mar 3rd, 2015 at 8:37pm:

progressiveslol wrote on Mar 3rd, 2015 at 6:55pm:

Prime Minister for Canyons wrote on Mar 3rd, 2015 at 9:32am:
My guess is Christopher Booker is writing this not from being a respected reasonable jouirno, but as someone who is basically anti-science.


Note that he also disputes passive smokings relationship with cancer as wells as asbestos role in health issues.

Is that the best ya got.

Try to keep up. Yes indeed, this will be the greatest scandal in the history of science


Well admittedly finding bias in an author who says its all a scam is pretty good ;)

It is not about the author, it is about the content of this thread. It is the out and out fraud of cool the past and warm the present.

the alleged fraud by a fraud  ;D ;D

Title: Re: Temperature data manipulation exposed
Post by The Outrage Bus on Mar 3rd, 2015 at 9:32pm

progressiveslol wrote on Mar 3rd, 2015 at 9:13pm:

Prime Minister for Canyons wrote on Mar 3rd, 2015 at 8:37pm:

progressiveslol wrote on Mar 3rd, 2015 at 6:55pm:

Prime Minister for Canyons wrote on Mar 3rd, 2015 at 9:32am:
My guess is Christopher Booker is writing this not from being a respected reasonable jouirno, but as someone who is basically anti-science.


Note that he also disputes passive smokings relationship with cancer as wells as asbestos role in health issues.

Is that the best ya got.

Try to keep up. Yes indeed, this will be the greatest scandal in the history of science


Well admittedly finding bias in an author who says its all a scam is pretty good ;)

It is not about the author, it is about the content of this thread. It is the out and out fraud of cool the past and warm the present.


Do yo not think that the authors bias would make his content doubtful?

Title: Re: Temperature data manipulation exposed
Post by progressiveslol on Mar 3rd, 2015 at 9:56pm

Prime Minister for Canyons wrote on Mar 3rd, 2015 at 9:32pm:

progressiveslol wrote on Mar 3rd, 2015 at 9:13pm:

Prime Minister for Canyons wrote on Mar 3rd, 2015 at 8:37pm:

progressiveslol wrote on Mar 3rd, 2015 at 6:55pm:

Prime Minister for Canyons wrote on Mar 3rd, 2015 at 9:32am:
My guess is Christopher Booker is writing this not from being a respected reasonable jouirno, but as someone who is basically anti-science.


Note that he also disputes passive smokings relationship with cancer as wells as asbestos role in health issues.

Is that the best ya got.

Try to keep up. Yes indeed, this will be the greatest scandal in the history of science


Well admittedly finding bias in an author who says its all a scam is pretty good ;)

It is not about the author, it is about the content of this thread. It is the out and out fraud of cool the past and warm the present.


Do yo not think that the authors bias would make his content doubtful?

If you can point me to something specific in the article you find doubtful, then ill join in.

Title: Re: Temperature data manipulation exposed
Post by Copper-toned-stunt on Mar 3rd, 2015 at 9:56pm

Prime Minister for Canyons wrote on Mar 3rd, 2015 at 9:32pm:

progressiveslol wrote on Mar 3rd, 2015 at 9:13pm:

Prime Minister for Canyons wrote on Mar 3rd, 2015 at 8:37pm:

progressiveslol wrote on Mar 3rd, 2015 at 6:55pm:

Prime Minister for Canyons wrote on Mar 3rd, 2015 at 9:32am:
My guess is Christopher Booker is writing this not from being a respected reasonable jouirno, but as someone who is basically anti-science.


Note that he also disputes passive smokings relationship with cancer as wells as asbestos role in health issues.

Is that the best ya got.

Try to keep up. Yes indeed, this will be the greatest scandal in the history of science


Well admittedly finding bias in an author who says its all a scam is pretty good ;)

It is not about the author, it is about the content of this thread. It is the out and out fraud of cool the past and warm the present.


Do yo not think that the authors bias would make his content doubtful?

Oh, i get it: because he is smoking crack he can't see words that start with the letter 'b'... it all makes sense now  :D :D

Title: Re: Temperature data manipulation exposed
Post by Copper-toned-stunt on Mar 3rd, 2015 at 9:59pm

progressiveslol wrote on Mar 3rd, 2015 at 9:56pm:

Prime Minister for Canyons wrote on Mar 3rd, 2015 at 9:32pm:

progressiveslol wrote on Mar 3rd, 2015 at 9:13pm:

Prime Minister for Canyons wrote on Mar 3rd, 2015 at 8:37pm:

progressiveslol wrote on Mar 3rd, 2015 at 6:55pm:

Prime Minister for Canyons wrote on Mar 3rd, 2015 at 9:32am:
My guess is Christopher Booker is writing this not from being a respected reasonable jouirno, but as someone who is basically anti-science.


Note that he also disputes passive smokings relationship with cancer as wells as asbestos role in health issues.

Is that the best ya got.

Try to keep up. Yes indeed, this will be the greatest scandal in the history of science


Well admittedly finding bias in an author who says its all a scam is pretty good ;)

It is not about the author, it is about the content of this thread. It is the out and out fraud of cool the past and warm the present.


Do yo not think that the authors bias would make his content doubtful?

If you can point me to something specific in the article you find doubtful, then ill join in.

** warning warning: circle jerk alert  ::)

Title: Re: Temperature data manipulation exposed
Post by The Outrage Bus on Mar 3rd, 2015 at 10:08pm

progressiveslol wrote on Mar 3rd, 2015 at 9:56pm:

Prime Minister for Canyons wrote on Mar 3rd, 2015 at 9:32pm:

progressiveslol wrote on Mar 3rd, 2015 at 9:13pm:

Prime Minister for Canyons wrote on Mar 3rd, 2015 at 8:37pm:

progressiveslol wrote on Mar 3rd, 2015 at 6:55pm:

Prime Minister for Canyons wrote on Mar 3rd, 2015 at 9:32am:
My guess is Christopher Booker is writing this not from being a respected reasonable jouirno, but as someone who is basically anti-science.


Note that he also disputes passive smokings relationship with cancer as wells as asbestos role in health issues.

Is that the best ya got.

Try to keep up. Yes indeed, this will be the greatest scandal in the history of science


Well admittedly finding bias in an author who says its all a scam is pretty good ;)

It is not about the author, it is about the content of this thread. It is the out and out fraud of cool the past and warm the present.


Do yo not think that the authors bias would make his content doubtful?

If you can point me to something specific in the article you find doubtful, then ill join in.


I could make the same riposte withyourself and any climate change article

Title: Re: Temperature data manipulation exposed
Post by progressiveslol on Mar 7th, 2015 at 11:31pm
Check out the way the fraud cool the past warm the present works.

Can Temperature Adjustments Right a Wrong?

Discussion

Automated methods to adjust raw temperature data collected from USHCN stations (and by extension, GHCN stations) are intended to improve the accuracy of regional and global temperature calculations to, in part, better monitor trends in temperature change. However, such adjustments show questionable skill in correcting the presumed flaws in the raw data. When comparing the raw data and adjustments from a USHCN station to a nearby CRN station, no improvement is apparent. It could be argued that the adjustments degraded the results. Furthermore, additional uncertainty is introduced when monthly averages are computed from incomplete data. This uncertainty is propagated when adjustments are later made to the data.

A Note on Cherry-Picking

Some will undoubtedly claim that I cherry-picked the data to make a point, and they will be correct. I specifically looked for the closest-possible CRN and USHCN station pairs, with the USHCN station having a class 1 or 2 rating. My assumption was that their differences would be minimized. The fact that a second CRN station was located less than a mile away cemented the decision to analyze this location. If anyone is able to locate a CRN and USHCN pair closer than 50 meters, I will gladly analyze their differences.


http://wattsupwiththat.com/2015/03/06/can-adjustments-right-a-wrong/

Title: Re: Temperature data manipulation exposed
Post by Copper-toned-stunt on Mar 9th, 2015 at 9:17pm

progressiveslol wrote on Mar 7th, 2015 at 11:31pm:
Check out the way the fraud cool the past warm the present works.

Can Temperature Adjustments Right a Wrong?

Discussion

Automated methods to adjust raw temperature data collected from USHCN stations (and by extension, GHCN stations) are intended to improve the accuracy of regional and global temperature calculations to, in part, better monitor trends in temperature change. However, such adjustments show questionable skill in correcting the presumed flaws in the raw data. When comparing the raw data and adjustments from a USHCN station to a nearby CRN station, no improvement is apparent. It could be argued that the adjustments degraded the results. Furthermore, additional uncertainty is introduced when monthly averages are computed from incomplete data. This uncertainty is propagated when adjustments are later made to the data.

A Note on Cherry-Picking

Some will undoubtedly claim that I cherry-picked the data to make a point, and they will be correct. I specifically looked for the closest-possible CRN and USHCN station pairs, with the USHCN station having a class 1 or 2 rating. My assumption was that their differences would be minimized. The fact that a second CRN station was located less than a mile away cemented the decision to analyze this location. If anyone is able to locate a CRN and USHCN pair closer than 50 meters, I will gladly analyze their differences.


http://wattsupwiththat.com/2015/03/06/can-adjustments-right-a-wrong/

Does real-estate franchise owning daddykins pay you in prawns and boring crayfish or what?

Has he told you yet that even he hates voting liberal and thus for copper internet in the asian century when he looks you in the eye and internally says "GET buggerED SON!" ;D ;D ;D ;D ;D ;D ;D

Title: Re: Temperature data manipulation exposed
Post by progressiveslol on Apr 11th, 2015 at 12:47am
Two-thirds of Australias warming due to “adjustments” — according to 84 historic stations


Here’s an update to the digging through our historic records we discussed a month ago, we can now include nearly twice the stations and the difference between temperatures originally recorded 100 years ago and temperatures today are even smaller.

Chris Gillham has been working with CSIR documents and official Commonwealth Year Books. Last month he used the 1953 Year Book which contained 44 weather station averages for 1911-40 to compare with 2000-14 temperatures, but has since discovered that the 1954 Year Book provides an additional 40 stations with 1911-40 data. The average rise in mean temperatures across all 84 weather stations around Australia over the last 70 years of global warming is about 0.3C. This larger dataset suggests as much as two thirds of the current official trend in Australian warming was due to post hoc adjustments, not heat recorded by thermometers.

These historic temperatures were calculated by the best scientists of the day, using the best equipment of the era (the same Stevenson Screen we use now). Yet again, global warming appears to have a “man-made” contribution. Far more important than CO2 is man-made “pollution” called homogenisation.

When doubling the recorded trend makes “No difference”

Bear in mind – some adjustments are necessary because raw is not automatically right. Stations have moved. But the Australian Met bureau can’t explain why all these adjustments are necessary, and indeed still claims the adjustments make no difference to the trend when clearly they do. Ken Stewart heard Dr Vertussy, the Director of the Bureau of Met (BoM), claim on radio last week that the adjustments make “no difference at all”. We look forward to Dr Vertussy’s reply.

And then there is the bizarreness of the half a degree adjusted cooling that occurs in these historic records when modern screens are much more likely to be near tarmac, bitumen, jumbo jets and 15 storey apartment blocks. The Urban Heat Island effect means that modern temperatures are artificially elevated in city CBDs by as much as 5- 7 C, with tests also showing several degrees of UHI at regional weather stations. So we have the paradox that the old records near dirt roads and horse drawn carriages were apparently reading artificially warm compared to thermometers today near roads with 10,000 internal combustion engines passing daily.


more
http://joannenova.com.au/2015/04/two-thirds-of-australias-warming-due-to-adjustments-according-to-84-historic-stations/

Title: Re: Temperature data manipulation exposed
Post by Copper-toned-stunt on Apr 11th, 2015 at 2:49am
... more joanne nova  :-? but wait...............THERE'S MORE  ::)

Title: Re: Temperature data manipulation exposed
Post by innocentbystander. on Apr 11th, 2015 at 7:55pm
Leave Jonova alone, she is beautiful and highly intelligent and you are just an ugly unemployed loser thats been sucked into a cult, I'm surprised that you and illogical baboon haven't gone down to Jonestown to drink cyanide yet.

Title: Re: Temperature data manipulation exposed
Post by Copper-toned-stunt on Apr 12th, 2015 at 6:19pm

innocentbystander. wrote on Apr 11th, 2015 at 7:55pm:
Leave Jonova alone, she is beautiful and highly intelligent and you are just an ugly unemployed loser thats been sucked into a cult, I'm surprised that you and illogical baboon haven't gone down to Jonestown to drink cyanide yet.

lol, femme fatale: run for the hills is the only option but,... we've all gotta learn the hard way I suppose  :o :o

Title: Re: Temperature data manipulation exposed
Post by lee on Apr 13th, 2015 at 2:39pm

BatteriesNotIncluded wrote on Apr 12th, 2015 at 6:19pm:
lol, femme fatale: run for the hills is the only option but,... we've all gotta learn the hard way I suppose


yep, Sounds right- Kill The Messenger.

Title: Re: Temperature data manipulation exposed
Post by innocentbystander. on Apr 13th, 2015 at 2:52pm

lee wrote on Apr 13th, 2015 at 2:39pm:

BatteriesNotIncluded wrote on Apr 12th, 2015 at 6:19pm:
lol, femme fatale: run for the hills is the only option but,... we've all gotta learn the hard way I suppose


yep, Sounds right- Kill The Messenger.


The idiot left are supposed to like whistle blowers ... unless they are blowing the whistle on the idiot lefts great climate change scam that is.  ;D

Title: Re: Temperature data manipulation exposed
Post by Rider on Apr 13th, 2015 at 2:52pm

lee wrote on Apr 13th, 2015 at 2:39pm:

BatteriesNotIncluded wrote on Apr 12th, 2015 at 6:19pm:
lol, femme fatale: run for the hills is the only option but,... we've all gotta learn the hard way I suppose


yep, Sounds right- Kill The Messenger.


It's hilarious this muppet is the nominated useful idiot defending the indefensible.

Title: Re: Temperature data manipulation exposed
Post by gizmo_2655 on Apr 13th, 2015 at 4:20pm

Rider wrote on Apr 13th, 2015 at 2:52pm:

lee wrote on Apr 13th, 2015 at 2:39pm:

BatteriesNotIncluded wrote on Apr 12th, 2015 at 6:19pm:
lol, femme fatale: run for the hills is the only option but,... we've all gotta learn the hard way I suppose


yep, Sounds right- Kill The Messenger.


It's hilarious this muppet is the nominated useful idiot defending the indefensible.


Who, Jo Nova, or Copper-Toned-Crack-Pipe??

Title: Re: Temperature data manipulation exposed
Post by Rider on Apr 13th, 2015 at 9:36pm

gizmo_2655 wrote on Apr 13th, 2015 at 4:20pm:

Rider wrote on Apr 13th, 2015 at 2:52pm:

lee wrote on Apr 13th, 2015 at 2:39pm:

BatteriesNotIncluded wrote on Apr 12th, 2015 at 6:19pm:
lol, femme fatale: run for the hills is the only option but,... we've all gotta learn the hard way I suppose


yep, Sounds right- Kill The Messenger.


It's hilarious this muppet is the nominated useful idiot defending the indefensible.


Who, Jo Nova, or Copper-Toned-Crack-Pipe??


The Coke Head Crack Pot...self appointed acolyte of all things except reality.

Title: Re: Temperature data manipulation exposed
Post by Copper-toned-stunt on Apr 14th, 2015 at 11:50am

innocentbystander. wrote on Apr 13th, 2015 at 2:52pm:

lee wrote on Apr 13th, 2015 at 2:39pm:

BatteriesNotIncluded wrote on Apr 12th, 2015 at 6:19pm:
lol, femme fatale: run for the hills is the only option but,... we've all gotta learn the hard way I suppose


yep, Sounds right- Kill The Messenger.


The idiot left are supposed to like whistle blowers ... unless they are blowing the whistle on the idiot lefts great climate change scam that is.  ;D

Dood, many a liberal voter know the weather has been changing for a long time and never went back to the farm after boarding school and their Dads didn't cry about it. Farming is being left to big business as it is only they who can deal with the boom bust nature of it.

The south east of Western Australia has been experiencing a long term observed decline in rainfall due to the anticyclones not reaching into the country like they used to: it all starts from the South pole!

Title: Re: Temperature data manipulation exposed
Post by Copper-toned-stunt on Apr 14th, 2015 at 11:53am

Rider wrote on Apr 13th, 2015 at 9:36pm:

gizmo_2655 wrote on Apr 13th, 2015 at 4:20pm:

Rider wrote on Apr 13th, 2015 at 2:52pm:

lee wrote on Apr 13th, 2015 at 2:39pm:

BatteriesNotIncluded wrote on Apr 12th, 2015 at 6:19pm:
lol, femme fatale: run for the hills is the only option but,... we've all gotta learn the hard way I suppose


yep, Sounds right- Kill The Messenger.


It's hilarious this muppet is the nominated useful idiot defending the indefensible.


Who, Jo Nova, or Copper-Toned-Crack-Pipe??


The Coke Head Crack Pot...self appointed acolyte of all things except reality.

It all starts from the South-pole: try telling Jo-fly that and she will reply on the forum, I guarantee it!

** You're Welcome, btw! ;D ;D ;D ;D ;D ;D ;D ;D ;D ;D ;D ;D ;D ;D ;D ;D ;D

Title: Re: Temperature data manipulation exposed
Post by lee on Apr 15th, 2015 at 11:09am
Amazing what CO2 can do; pushing rainfall this way and that.

Title: Re: Temperature data manipulation exposed
Post by Copper-toned-stunt on Apr 15th, 2015 at 11:17am

lee wrote on Apr 15th, 2015 at 11:09am:
Amazing what CO2 can do; pushing rainfall this way and that.

Weightless gases are amazing  ;D ;D ;D ;D ;D ;D ;D ;D ;D ;D ;D ;D ;D ;D ;D ;D ;D ;D ;D ;D ;D ;D

Title: Re: Temperature data manipulation exposed
Post by innocentbystander. on Apr 15th, 2015 at 2:33pm
We need to ban CO2 and we need to ban it NOW  :D

Title: Re: Temperature data manipulation exposed
Post by Copper-toned-stunt on Apr 15th, 2015 at 2:51pm

innocentbystander. wrote on Apr 15th, 2015 at 2:33pm:
We need to ban CO2 and we need to ban it NOW  :D

But it's a weightless gas,...  ;D ;D ;D

Title: Re: Temperature data manipulation exposed
Post by progressiveslol on Apr 27th, 2015 at 1:23am
Looks like the gig is up for the fraudsters that give us homogenised BS fraudulent temperature data.

Inquiry Launched Into Global Temperature Data Integrity

http://wattsupwiththat.com/2015/04/26/inquiry-launched-into-global-temperature-data-integrity/


Title: Re: Temperature data manipulation exposed
Post by progressiveslol on Aug 17th, 2015 at 5:59pm
As I have stated earlier, the frauds can only cool the past and warm the present for so long until it becomes so obvious, that even a child would recognise the fraud. Well, the time for that is getting very very near.


Professor Robert Brown of Duke University

The two data sets should not be diverging, period, unless everything we understand about atmospheric thermal dynamics is wrong. That is, I will add my “opinion” to Werner’s and point out that it is based on simple atmospheric physics taught in any relevant textbook.

This does not mean that they cannot and are not systematically differing; it just means that the growing difference is strong evidence of bias in the computation of the surface record. This bias is not really surprising, given that every new version of HadCRUT and GISS has had the overall effect of cooling the past and/or warming the present! This is as unlikely as flipping a coin (at this point) ten or twelve times each, and having it come up heads every time for both products. In fact, if one formulates the null hypothesis “the global surface temperature anomaly corrections are unbiased”, the p-value of this hypothesis is less than 0.01, let alone 0.05. If one considers both of the major products collectively, it is less than 0.001. IMO, there is absolutely no question that GISS and HadCRUT, at least, are at this point hopelessly corrupted.

....
....

Right now, to be frank, the divergence is already large enough to be raising eyebrows, and is concealed only by the fact that RSS/UAH only have a 35+ year base. If the owners of HadCRUT and GISSTEMP had the sense god gave a goose, they’d be working feverishly to cool the present to better match the satellites, not warm it and increase the already growing divergence because no atmospheric physicist is going to buy a systematic divergence between the two, as Werner has pointed out, given that both are necessarily linked by the Adiabatic Lapse Rate which is both well understood and directly measurable and measured (via e.g. weather balloon soundings) more than often enough to validate that it accurately links surface temperatures and lower troposphere temperatures in a predictable way. The lapse rate is (on average) 6.5 C/km. Lower Troposphere temperatures from e.g. RSS sample predominantly the layer of atmosphere centered roughly 1.5 km above the ground, and by their nature smooth over both height and surrounding area (that is, they don’t measure temperatures at points, they directly measure a volume averaged temperature above an area on the surface. They by their nature give the correct weight to the local warming above urban areas in the actual global anomaly, and really should also be corrected to estimate the CO_2 linked warming, or rather the latter should be estimated only from unbiased rural areas or better yet, completely unpopulated areas like the Sahara desert (where it isn’t likely to be mixed with much confounding water vapor feedback).

RSS and UAH are directly and regularly confirmed by balloon soundings and, over time, each other. They are not unconstrained or unchecked. They are generally accepted as accurate representations of LTT’s (and the atmospheric temperature profile in general).
The question remains as to how accurate/precise they are. RSS uses a sophisticated Monte Carlo process to assess error bounds, and eyeballing it suggests that it is likely to be accurate to 0.1-0.2 C month to month (similar to error claims for HadCRUT4) but much more accurate than this when smoothed over months or years to estimate a trend as the error is generally expected to be unbiased. Again this ought to be true for HadCRUT4, but all this ends up meaning is that a trend difference is a serious problem in the consistency of the two estimators given that they must be linked by the ALR and the precision is adequate even month by month to make it well over 95% certain that they are not, not monthly and not on average.

much more
http://wattsupwiththat.com/2015/08/14/problematic-adjustments-and-divergences-now-includes-june-data/

Title: Re: Temperature data manipulation exposed
Post by gizmo_2655 on Aug 17th, 2015 at 6:09pm

Rider wrote on Apr 13th, 2015 at 9:36pm:

gizmo_2655 wrote on Apr 13th, 2015 at 4:20pm:

Rider wrote on Apr 13th, 2015 at 2:52pm:

lee wrote on Apr 13th, 2015 at 2:39pm:

BatteriesNotIncluded wrote on Apr 12th, 2015 at 6:19pm:
lol, femme fatale: run for the hills is the only option but,... we've all gotta learn the hard way I suppose


yep, Sounds right- Kill The Messenger.


It's hilarious this muppet is the nominated useful idiot defending the indefensible.


Who, Jo Nova, or Copper-Toned-Crack-Pipe??


The Coke Head Crack Pot...self appointed acolyte of all things except reality.


I sort of figured that....I was just checking though.

Title: Re: Temperature data manipulation exposed
Post by BowDownToCHOPPERINTERNETGATE on Aug 18th, 2015 at 1:35pm

lee wrote on Apr 15th, 2015 at 11:09am:
Amazing what CO2 can do; pushing rainfall this way and that.

Heat content causes weather!

:o

Title: Re: Temperature data manipulation exposed
Post by lee on Aug 18th, 2015 at 4:14pm

BatteriesNotIncluded wrote on Aug 18th, 2015 at 1:35pm:
Heat content causes weather


Yes, the greater the discrepancy between weather cells. the more violent the weather.

Title: Re: Temperature data manipulation exposed
Post by Mal_whatuploadspeed_Turnbull on Nov 18th, 2015 at 11:41pm

lee wrote on Aug 18th, 2015 at 4:14pm:

BatteriesNotIncluded wrote on Aug 18th, 2015 at 1:35pm:
Heat content causes weather


Yes, the greater the discrepancy between weather cells. the more violent the weather.

sweeeeeeeeeeeeeeeeeeeeeeeeeeeeeeeeeeeeeeeeeeeeeeeeeeeeeet  ::)

Australian Politics Forum » Powered by YaBB 2.5.2!
YaBB Forum Software © 2000-2025. All Rights Reserved.