Australian Politics Forum
http://www.ozpolitic.com/forum/YaBB.pl
Member Run Boards >> Environment >> Catalyst: Taking Our Temperature
http://www.ozpolitic.com/forum/YaBB.pl?num=1377319847

Message started by # on Aug 24th, 2013 at 2:50pm

Title: Catalyst: Taking Our Temperature
Post by # on Aug 24th, 2013 at 2:50pm
This began as a response to http://www.ozpolitic.com/forum/YaBB.pl?num=1377215387/0#0 which was, strangely, first posted to the "Politicians Suck" board. I reckon it's more appropriate in Environment.

http://mpegmedia.abc.net.au/tv/catalyst/catalyst_s13_ep25_TakingAustraliasTemp.mp4

NARRATION
Have you noticed anything odd round your place lately? A fish you've never caught before. Unusual events. Weird weather. Well, I've certainly noticed something odd round my home.

Dr Jonica Newby
I bought this place 12 years ago. And, in that whole time, it never flooded. Nor in the 20 years the old guy had it before me. In the last two years, it's flooded ten times.

NARRATION
I've pretty much stopped mopping. And, like many of us, as I survey the damage, I wonder if this is Climate Change, a rogue La Nina or just a really rainy year. Has the weather changed in the last 100 years or not? So, I'm heading on an investigation that's all about the simple facts. Real tidal gauges, actual temperature records. And this will be a proper weather report, going round Australia to the places you and I live and play. It's time to take the temperature of Australia. And, when it comes to weather, there's one organisation perfectly placed to guide me. They formed 100 years ago. They are the Bureau of Meteorology.

Dr Jonica Newby
Hello, Karl.

Dr Karl Braganza
How's it going, Jonica?

Dr Jonica Newby
Good. And... So you're going to run us through a national, 100-year Australia health check/weather report.

Dr Karl Braganza
That's right. Today we're going to do a national round-up of Australia's temperature, hydration and its circulation.

Dr Jonica Newby
Fantastic. So I reckon we start straightaway with temperature, which means I'm heading... here.

NARRATION
I don't want to start with the heat, but with the cold. Is it as cold as it used to be? And where better to view the cold than from our nation's frosty tips? Our enchanted, legendary snowy mountains... where I love to ski.

Dr Jonica Newby
You may think me elitist, but I prefer to think it's the genetic imperative of my Norwegian ancestry.

NARRATION
And those Nordic genes of mine have a keen interest in what's happened to the snow.

Dr Jonica Newby
Well, this is 1964, the biggest dump on record. You look at photos like this, and you think things must have changed. But have they really? Is it anecdotal or real? To find out, you have to go to the records.

NARRATION
We're off to Spencer's Creek, where the Snowy Hydro scheme has been taking snow-depth measures every week since 1954. Dr Ken Green has been monitoring the snow for decades.

Dr Kenneth Green
We've got 65 inches, which...

Dr Jonica Newby
Inches?!

Dr Kenneth Green
Yes, inches. It's been done since 1954. So they're not going to change their methods now.

Dr Jonica Newby
(Laughs)

Dr Kenneth Green
Which is about... 162cm.

NARRATION
Snow cover swings wildly from year to year. So the best way to see the signal in the record is to compress it into five-year average trends.

Dr Jonica Newby
So, how are we going to do the trend line?

Dr Kenneth Green
We'll put this in as the trend line.

NARRATION
Hmm. In 60 years, we've lost a third of our total snow cover. But there is some rough comfort for my skiing aspirations. And that is that the beginning of the season hasn't really changed.

Dr Jonica Newby
So, basically, since 1954, snow depth in July is much the same. When you reach September, it starts to drop off. So that by October it's noticeably less. Essentially, spring is coming earlier.

NARRATION
It's even clearer when you look at the records for the thaw, now two weeks earlier than in the '60s. And the snowline appears to have lately moved up from 1,500m to 1,600m.

Dr Kenneth Green
This actually used to be a ski run, coming down here across the road. And now you wouldn't even dream of it.

NARRATION
So what HAS happened to Australia's cold?

Dr Jonica Newby
Right. Our first national round-up. So we're looking at minimum temperatures. And, Karl, basically, this is how cold it gets at night.

Dr Karl Braganza
That's correct, Jonica. If we start at the Snowy here, we've warmed by about 1.1 degrees since a century ago. And that's similar to Perth, Sydney. If we're looking over here at Cairns, it's almost 2 degrees since 1910.

Dr Jonica Newby
Two degrees, so hot nights.

Dr Karl Braganza
Well, hotter nights than they used to have, yeah - on average.

NARRATION
And how do we know this to be true? Well, because, frankly, the data collection behind it is mind-boggling. This is the Victorian regional headquarters of the Bureau of Meteorology.

Dr Jonica Newby
So how many things are kind of feeding into all of this?

Kevin Parkyn
Um, too much, really for the brain to comprehend, to be honest. And that's why we have a lot of alerts that help us.

NARRATION
There are nearly 800 weather stations across Australia, with over 500 now fully automated. Of these, 112 sites have information that historically goes back far enough and is accurate enough to count as blue-chip and be used as part of the 100-year record.

[continued ...]
Title: Re: Catalyst: Taking Our Temperature
Post by # on Aug 24th, 2013 at 2:54pm
[... continued]

Dr Jonica Newby
OK, so, to be in the top 100, you have to have a few things going for you. First of all - quality instruments. So this is a fully automated platinum temperature probe. Second, you have to have reliable records. So these platinum records go back to 2001. And then this old-fashioned but still accurate mercury goes back to 1910.

NARRATION
Third, the station has to be well away from urban heat islands, so not in a big city. All this data is then fed by cables to central stations at the national bureau headquarters in Melbourne, where it ends up here.

Dr Jonica Newby
I'm on the secret level of the bureau now. This is the lair of the weather supercomputers. They have their own full-time staff of 22 IT slaves on 24-hour call making sure nothing upsets them.

NARRATION
A gazillion cable feeds are swallowed here, digested and then spat over there.

Dr Jonica Newby
This temperature controlled block of pampered bits and bytes contains all the records. This, essentially, is the history of Australia's weather.

NARRATION
And this is how the bureau knows how much minimum temperatures have gone up in 100 years.

Dr Jonica Newby
So that's night-time minimums, but I bet what most of you are more interested in is what's happened to daytime maximums. And, for that... I'm heading here.

NARRATION
This is another one of my favourite spots in Australia - sassy, sexy, St Kilda, Melbourne.

Dr Jonica Newby
I lived here in my 20s, and, coming from Sydney and Perth, can I say Melbourne had a bit of a reputation for its weather?

NARRATION
So, when I moved here, I bought a coat, a scarf, gloves, and these, but what no-one told me was how darn hot it was going to get. And I'm not the only one shedding her coat early. Butterflies are really temperature-sensitive. Melbourne's common brown butterfly now emerges from its chrysalis nearly two weeks earlier than in 1940. So, how much hotter has Melbourne got?

Dr Jonica Newby
OK, Doctor, our national round-up of maximum temperatures. So what do we have?

Dr Karl Braganza
You can see here - Sydney through to Melbourne, Canberra, Hobart, they've warmed up by about 0.7 of a degree. And in some capitals a lot less. Adelaide - 0.3. But if you go over to the west - Perth - and into the centre - Alice Springs - you've got 1.1 to almost 2 degrees of warming.

Dr Jonica Newby
Wow.

NARRATION
In 100 years, the centre has heated up more than the coast.

Dr Jonica Newby
So, the further inland you are, in Australia, the more the maximum temperatures will have gone up?

Dr Karl Braganza
As a general trend, yeah.

NARRATION
Overall, averaging maximums and minimums, our nation's core temperature has gone up 0.9 of a degree. But, in 2009, Victoria's temperature spiked in a lethal fever.

Dr David Jones
In Melbourne we saw the previous February record broken by more than 3 degrees.

NARRATION
Melbourne hit 46.5 degrees. Hopetoun hit 48.8.

Dr David Jones
We broke the Victorian record by 1.6 degrees. You know, these are records going back over 50 years. You know, you're not breaking 'em by... by, you know, a few tenths of a degree - you're breaking 'em by whole degrees or more.

NARRATION
And you know what happened next. Of course, it became known as 'Black Saturday'. 173 people died in those fires, but they weren't the only casualties of this extreme heat event.

NARRATION
When health researchers went back over the mortality records, it turned out an extra 370 people died during that week than you'd expect.

Dr Jonica Newby
Essentially, it means that they were tipped over the edge by heat stress. There's a rather confronting in-house term that's used for this. They call it 'premature harvesting'.

NARRATION
And it isn't just humans feeling the heat. One day, on a country golf course way down south in WA, it started raining black cockatoos. It certainly surprised the locals, let alone the birds. The year was 2010, and the temperature hit 48 degrees. An entire flock of endangered Carnaby's cockatoos literally cooked where they roosted. And can you see what these are? Budgerigars. Budgerigars that fell from the sky during another WA heatwave in 2009.

Dr Jonica Newby
Alright, so this next diagnostic is... a measure of extremes.

Dr Karl Braganza
It is. And what we've seen is more and more stations are breaking extreme heat in the last 100 years, and less are breaking extreme cold.

NARRATION
In fact, in the last ten years, the number of stations breaking extreme heat records has doubled those breaking extreme cold.

Dr Karl Braganza
So, frosty nights are becoming less common, but extreme heat days are becoming more common.

NARRATION
Now, some of my friends like to joke that if things go really pear-shaped we can always move to Tassie. Well, one company already has. It's a company that makes something dear to many of our hearts - alcohol.

Dr Jonica Newby
I love the smell of baby wine growing in the morning.

NARRATION
Two years ago, a famously Victorian company bought up big here in Tasmania. And they did so specifically to future-proof themselves against temperature. They are the family dynasty Brown Brothers, though I seem to have found myself a Brown sister.

[continued ...]

Title: Re: Catalyst: Taking Our Temperature
Post by # on Aug 24th, 2013 at 2:58pm
[... continued]

Dr Jonica Newby
So, had you actually noticed some damage to your bottom line, basically, due to temperatures?

Katherine Brown
Yeah. Um, we... Well, we put up with ten years of drought.

Dr Jonica Newby
Yeah.

Katherine Brown
Um, and also, um, one of our vineyards in Victoria where we grow our top-quality sparkling wines... We got the warmer weather earlier, and the bud bursts had already come through, so the frost came in and actually killed all the shoots. That wiped out a whole vintage.

NARRATION
The wine industry's detailed records show grapes in Australia's south are ripening, on average, 20 days earlier than in 1985.

Katherine Brown
Talking to our scientists, winemakers and viticulturists, um, they really pretty much turned to the board and said, 'We have to find this cooler-climate property because within decades we could see a 2-degrees temperature rise in our current vineyards in Victoria.' So, they pretty much told us that if we continued to want to do what we do best, make quality wine, we had to come south.

NARRATION
And now I'd like to demonstrate a little game of chance.

Dr Jonica Newby
So the chance of one month being above-average temperature, is one in two. The chance of the next month also being above-average temperature, is one in four. The chance of the next month also being above-average temperature, is one in eight.

NARRATION
So what do you think are the chances of having 330 months in a row of above-average temperatures? Because, since February 1985, we have had... 330 months in a row of above-average (global) temperatures.

Dr Mark Howden
It's really extraordinary. If it was just by random chance alone, then there's only a 1 in 100,000 chance that that would have happened in the absence of human influence.

Dr Jonica Newby
So, this bottle of red represents the chance that that run of temperature increase was caused by natural variability, sunspots or volcanoes.

Dr Mark Howden
That's right.

Dr Jonica Newby

Right!

Dr Jonica Newby
I think we should drink it.

Dr Jonica Newby
Cheers.

NARRATION
So that's temperature. Next up, I want to check on Australia's state of circulation. I mean that stuff we're girt by - the sea. I'm still in Tassie because something odd has been happening in these waters - strange sightings, mysterious beasties where never before seen.

Dr Jonica Newby
I'm talking fish. And where there's fish, there's a fishing story.

Mark Nikolai
It was about two years ago, and I can remember it vividly. I saw a small group of fish come towards us. I said to my son, 'Wheel in your rod as fast as you possibly can.' When suddenly - bang. It just took off. The reel itself was actually screaming. My son didn't know what to do. He said, 'Dad, Dad, what do I do, what do I do?' I said, 'Nothing, son. Just hang on to the reel and wait for the fish to slow down.' So that's what we did. It took us about 40 minutes, I suppose.

Dr Jonica Newby
40 minutes?!

Mark Nikolai
40 minutes because the fish weighed more than the line capacity.

NARRATION
Brand spanking new to Tasmania, it was a yellow-tailed kingfish.

Dr Jonica Newby
A real yellow-letter day.

Mark Nikolai
That's it.

NARRATION
It's exciting times for Tasmanian fishermen. With so many new fish arriving, they've teamed up with scientists to plot them. They've seen leather jacks, green turtles, dusky morwong...

Mark Nikolai
It's actually really good news for Tasmanian fishermen, 'cause all the New South Wales fish are moving south into our waters.

NARRATION
All in all, scientists have confirmed 45 new species have, like Brown Brothers, shipped on down to Tassie.

Dr Jonica Newby
Well, obviously, if fish from the big island are moving down, the water here must have got warmer.

NARRATION
How much warmer?

Dr Jonica Newby
It's not too bad. Ooh, yes it is!

Dr Jonica Newby
Alright, Dr Karl. National round-up time again. 100-year health check. Circulation.

Dr Karl Braganza
Sure. What we're going to look at now, Jonica, is the sea-surface temperatures around Australia. And what we've seen is about a degree of warming over the last century. But you can see over the East Coast we have more warming than we do over the West Coast. There's some hot spots as well. And that's off the coast of Victoria, Tasmania.

NARRATION
Sea temperatures here off Tasmania have risen an astounding 2.28 degrees. That's about four times the global ocean average.

Dr Karl Braganza
And we think that's got something to do with changes in the East Australian Current, but we're not exactly sure why.

NARRATION
And, last year, West Australia's blood began to boil. Time to visit my childhood home. I'm a Cottosloe girl, Which means I grew up not noticing how wide the verges are...

Dr Jonica Newby
You can fit a whole Sydney house on this verge!

NARRATION
..and dodging sharks on my local beach. And over there is Rottnest - Perth's playground.

Dr Jonica Newby
I think I've swum in just about every rock pool round here. And, look, the water was lovely and warm. But what I'm about to tell you shocks me. Last year, on 28th February, the water in here hit 26.4 degrees. 26.4 degrees?! That's ridiculous.

NARRATION
It killed the coral.

[continued ...]

Title: Re: Catalyst: Taking Our Temperature
Post by # on Aug 24th, 2013 at 3:02pm
[... continued]

Dr Jonica Newby
And has that ever happened here at Rottnest?

Dr Damian Thompson
Not that we're aware of. Not in 40 metres of water.

NARRATION
In fact, it was part of the biggest heatwave to hit Australia's waters ever. It began just north of Ningaloo Reef, hitting it heartbreakingly with the force of a pot of boiling oil.

Dr Damian Thompson
In some places, up to 80% of what was there before is now no longer there.

Dr Jonica Newby
Really just gone. Dead. So that's it.

Dr Damian Thompson
Gone, dead, yeah. Covered in algae.

NARRATION
It travelled 1,200km south, reaching all the way to the southernmost tip of WA.

Dr Jonica Newby
Apparently, whale sharks were seen off Albany! Is that right?

Dr Damian Thompson
Mm. Mm.

Dr Jonica Newby
Whale sharks! Do you know how far south Albany is? That is not whale shark country. That is white shark country!

NARRATION
Not that it's a laughing matter for the whale sharks.

Dr James Moore
They're effectively outrunning the hot water in search of cooler water and bait and feed to actually sustain them through that period.

NARRATION
The whole event lasted five months. It's our most extreme hot-water event on record.

Dr Jonica Newby
So there's actually something significant we should know about these rises that we've seen in sea temperature?

Dr Karl Braganza
Yeah, absolutely. Changes in ocean temperature around Australia really impact on the type of weather we receive.

Dr Jonica Newby
So, the warmer the water...?

Dr Karl Braganza
The warmer the water, generally the more rainfall that you'd expect.

Dr Jonica Newby
Well, still on our nation's circulation, what 100-year health check would be complete without blood pressure? I may be stretching the medical metaphor a little bit here, but I'm talking about sea level.

NARRATION
This is the glorious old West Australian port town of Fremantle. And it's home to one of Australia's oldest continuous tide gauge records.

Dr Jonica Newby
So this is the original Fremantle port's tidal gauge from 1897. Beautiful piece of machinery, isn't it?

And this is the latest tidal gauge. And, between them, what they chart is on average a 1.5mm rise per year since 1900.

NARRATION
Now, many of you may already be doing the maths on what that amounts to over 110 years. But, while you do that, I'm jumping back to the bottom of Australia - to Tassie's infamous Port Arthur, where there's a fantastic old marking that will answer that question. In 1841, the local storekeeper put in a tide mark, the oldest scientific one in the country.

Dr John Hunter
OK. It's just down there. There's a little...

Dr Jonica Newby
Oh! Right.

Dr John Hunter
..horizontal line with an arrow pointing down towards it.

Dr Jonica Newby
Yeah.

NARRATION
When the original records were rediscovered just a decade ago, Dr John Hunter was able to work out what's happened.

Dr John Hunter
OK, the total sea-level rise since 1841...

Dr Jonica Newby
Yeah.

Dr John Hunter
..is about 17 centimetres. And that's the length of that...

Dr Jonica Newby
Yeah?

Dr John Hunter
..that stick. If you compare that with Fremantle...

Dr Jonica Newby
Yep.

Dr John Hunter
..on the other side of the country, about 17 centimetres again since 1897.

Dr Jonica Newby
1897? OK, so that is a 100-year record, really, for Australia.

Dr John Hunter
Pretty well, yep, yep.

Dr Jonica Newby
This is how much it's gone up.

Dr John Hunter
Yep.

Dr Jonica Newby
17cm.

NARRATION
And this seemingly small rise has dramatically changed flooding. Last year, Port Arthur copped it like never before.

NARRATION
Using the historic Australian records, John Hunter has been able to show just how much each 10 centimetres rise in sea level has contributed to events like this.

Dr John Hunter
So, if you raise sea level by just 10 centimetres...

Dr Jonica Newby
Yeah.

Dr John Hunter
..you find you get a tripling of the number of flooding events.

Dr Jonica Newby
A tripling?

Dr John Hunter
And if you raise it by another 10 centimetres, it goes up by another factor of three, so that's a total of nine.

Dr Jonica Newby
So... so we've got nine times, effectively, the number of flooding events for structures at sea level than we did 100 years ago?

Dr John Hunter
Yes. That's right.

Dr Jonica Newby
I am surprised by that.

Dr John Hunter
It's a big change, yep.

Dr Jonica Newby

Yeah.

Dr Jonica Newby

So these are our current 'blood pressure', AKA 'sea level', readings. How are they looking?

Dr Karl Braganza
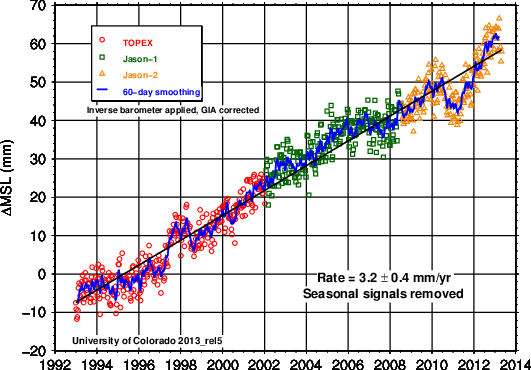
So what we're looking at here is basically from the satellite record from 1993. And we can see sea levels have risen everywhere. Red on this part up the top of the continent is a lot of sea-level rise. And the blue parts down the bottom is where we've had rather less sea-level rise.

NARRATION
Sea level naturally goes up and down a lot from year to year, but we can see from the Fremantle record the trend line is relentless.

Dr Jonica Newby
Which brings us last but not least to the final round of our 100-year health check - assessing our nation's state of hydration.

[continued ...]

Title: Re: Catalyst: Taking Our Temperature
Post by # on Aug 24th, 2013 at 3:05pm
[... continued]

NARRATION
Well, lately, parts of Australia have been well hydrated. Overhydrated, in fact. My personal assessment is that it's barely stopped raining in the last two years. My cottage has sprung a leak.

Dr Jonica Newby
I'm thinking of calling it 'Newby Creek'.

NARRATION
Our dams around Sydney and Brisbane are full. And there have been record-breaking floods... in Brisbane, Victoria, New South Wales. But, again, IS it new? What do the trusty old rain gauges from the bureau say?

Dr Jonica Newby
So, now, the last two years' rainfall have been quite extraordinary, haven't they?

Dr Karl Braganza
They have. They've been record-breaking. So, over the last 24-month period, the two years, we've seen more rainfall in Australia for a 24-month period than we've ever seen in the historical record.

Dr Jonica Newby
And tell me - does this have something to do with the fact that the ocean and the air temperatures are higher?

Dr Karl Braganza
Normally, when you get a La Nina event you'll get almost record rainfall in Australia. This time, what we saw was record sea-surface temperatures around Australia. And so we've got basically a perfect storm. We've got a La Nina event. We've got global warming going on in the oceans around Australia. And then we've got this record rainfall as well.

NARRATION
But you'll see there's one part of Australia noticeably absent from this acute attack of fluid retention. It's my old stamping ground - the south-west of WA... which is where I am now, down amongst the karri trees. Well, underneath them, actually - inside glorious Jewel Cave.

Dr Jonica Newby
OK, so this is what I came here to show you. You see this black line? That's actually a water line, the high water mark from the late '60s. This was once a lake. Up to here. But, ever since then, the water has just drained away.

NARRATION
The last of the water disappeared by the year 2000. And it's the same sad story across the region. The caves of Margaret River have lost their lakes and streams. Land use changes have compounded the problem, but this is a symptom of chronic dehydration.

Dr Karl Braganza
So what we've got here is basically rainfall during April to November. And, in the last 15 years, in particular in the south-east of the continent, here, is about a 10% to 20% reduction in that rainfall.

Dr Jonica Newby
That much, yeah.

Dr Karl Braganza
That's right. And over here in the west we've seen the same thing, but that's actually occurred since about 1970, so they've had almost about four decades with much less winter rainfall than they used to have.

NARRATION
And now the big summary. What has happened to our weather?

Dr Jonica Newby
Well, we're ready for the final report in Australia's 100-year health check. So, hydration?

Dr Karl Braganza
Wetting up north, in the Tropics. Longer-term dehydration across the south, particularly in south-west WA.

Dr Jonica Newby
OK. Circulation?

Dr Karl Braganza
Sea level's increasing all around Australia. Um... not lapping at our toes yet.

Dr Jonica Newby
Finally - temperature.

Dr Karl Braganza
Temperatures around Australia have risen by about a degree. Um, less chills, more fevers. And some regional variation in that as well. So some regions are heating up more than others.

NARRATION
Essentially, what the records show is that global warming isn't something that's coming - it's here in our backyards already. It's pointless now to ask, 'Is this climate change or natural variability?' What we see is one acting on top of the other.

Dr Karl Braganza
So, every parcel of air, every ocean current, every weather system is now about a degree warmer. And when you go through and do the physics, that's actually a hell of a lot of energy added to the climate system in general.

Dr Jonica Newby
You know, of all the things I learned on this investigation, it was that comment from Karl that really struck me. It was like, 'Aha! I finally get it.' There's one degree of extra heat across the whole planet. That's just a lot of new energy in our weather system. What happens when you add another degree? And another?

NARRATION
So what WILL happen in the future? Well, I'm obviously going to have to spend some money on a retaining wall. And, like the rest of us, I'll try to do my bit. But I'll continue to toast my sunset, pray to my snow gods and get as much joy as I always have out of the parts of Australia I love. I do think I should do so with eyes wide open, though, and not pretend there's no change to see.

Title: Re: Catalyst: Taking Our Temperature
Post by Ajax on Aug 24th, 2013 at 3:35pm

Quote:
http://news.ninemsn.com.au/national/2013/08/22/22/24/aust-sucks-up-ocean-s-waters-study

New US research shows Australia's dry soil and mountainous coastline soaked up heavy rainfall in 2010 and 2011 and stopped it from flowing back into the ocean.

That effectively halted a longterm trend of rising sea levels which have been caused by higher temperatures and melting ice sheets.

"No other continent has this combination of atmospheric set-up and topography," scientist John Fasullo, who worked on the study, said in a statement.

"Only in Australia could the atmosphere carry such heavy tropical rains to such a large area, only to have those rains fail to make their way to the ocean."

The world's oceans have been rising in recent decades by around three millimetres every year.

This is partly because heat has caused water to expand, and partly because run-off from retreating glaciers and ice sheets has made its way into the oceans.

But for an 18-month period beginning in 2010, the oceans mysteriously dropped by about seven millimetres, more than offsetting the annual rise, the study says.

The US scientists say this was mainly caused by Australia's uniquely dry soil and land surface.

While some of the water evaporated in the desert sun, much of it sank into the dry, granular soil of the Western Plateau or filled the Lake Eyre basin in the east

http://www.ozpolitic.com/forum/YaBB.pl?num=1377215387/0#0


LMFAO.....ROFL.......ROFL..........LOL

Excuse me I laughed so much I cried, just let me get a hold.........LOL

So then all the rain fell on Australia and that's why sea levels dropped by 7mm..........

LMFAO.....ROFL.......ROFL..........LOL

Excuse me I laughed so much I cried, just let me get a hold.........LOL

It had that effect again i'm sorry..........I cant control it..LOL

So......all the rain fell on Australia and not in the sea that's why oceans have dropped 7mmm.

What a whole lot of malarkey..................!!!!!!

Storms form over the sea don't they, if then some wind pushed them over land and they drop their load on the land this in some way will reduce the sea level by 7mm.

How more ridicules will the AGW religious church get.

Get a grip ffs.

THAT WAS THE BEST LAUGH I'VE HAD IN A WHILE.

So I thank you for that.....!!??

Title: Re: Catalyst: Taking Our Temperature
Post by Rider on Aug 24th, 2013 at 5:32pm
Dr Jonica Newby.....partner of 100mt of sea level rises Robyn Williams...

now that is a hoot.. ;D ;D talk about a fluff piece

I just need to add that Jonica is a vet......and...a science commentator and former mouthpiece for some rag or another.

looks like # has been on the hash too long  8-)

(but no doubt she has been peer reviewed aye Muse....cause that'll make all the difference  ;D ;D ;D ;D)

Title: Re: Catalyst: Taking Our Temperature
Post by rabbitoh07 on Aug 24th, 2013 at 5:53pm

Ajax wrote on Aug 24th, 2013 at 3:35pm:

Quote:
http://news.ninemsn.com.au/national/2013/08/22/22/24/aust-sucks-up-ocean-s-waters-study

New US research shows Australia's dry soil and mountainous coastline soaked up heavy rainfall in 2010 and 2011 and stopped it from flowing back into the ocean.

That effectively halted a longterm trend of rising sea levels which have been caused by higher temperatures and melting ice sheets.

"No other continent has this combination of atmospheric set-up and topography," scientist John Fasullo, who worked on the study, said in a statement.

"Only in Australia could the atmosphere carry such heavy tropical rains to such a large area, only to have those rains fail to make their way to the ocean."

The world's oceans have been rising in recent decades by around three millimetres every year.

This is partly because heat has caused water to expand, and partly because run-off from retreating glaciers and ice sheets has made its way into the oceans.

But for an 18-month period beginning in 2010, the oceans mysteriously dropped by about seven millimetres, more than offsetting the annual rise, the study says.

The US scientists say this was mainly caused by Australia's uniquely dry soil and land surface.

While some of the water evaporated in the desert sun, much of it sank into the dry, granular soil of the Western Plateau or filled the Lake Eyre basin in the east

http://www.ozpolitic.com/forum/YaBB.pl?num=1377215387/0#0


LMFAO.....ROFL.......ROFL..........LOL

Excuse me I laughed so much I cried, just let me get a hold.........LOL

So then all the rain fell on Australia and that's why sea levels dropped by 7mm..........

LMFAO.....ROFL.......ROFL..........LOL

Excuse me I laughed so much I cried, just let me get a hold.........LOL

It had that effect again i'm sorry..........I cant control it..LOL

So......all the rain fell on Australia and not in the sea that's why oceans have dropped 7mmm.

What a whole lot of malarkey..................!!!!!!

Storms form over the sea don't they, if then some wind pushed them over land and they drop their load on the land this in some way will reduce the sea level by 7mm.

How more ridicules will the AGW religious church get.

Get a grip ffs.

THAT WAS THE BEST LAUGH I'VE HAD IN A WHILE.

So I thank you for that.....!!??

Sorry you interrupt your jollies - but what is it you find funny?

Australia is a very large landmass that received an extraordinary amount of rainfall in 2010/11.

Unlike other continental landmasses - the vast majority of this rainfall did not flow back to the oceans, but flowed to inland basins

When a very large amount of water does not flow back into the ocean when it would normally flow back into the ocean - what do you think might happen to the amount of water in the ocean.

THink carefully.
THis is not a trick question.

Here is the peer-rewieved paper the article was referring to:

Why don't you explain to us what the researcher got wrong.
Could you do that?

http://onlinelibrary.wiley.com/doi/10.1002/grl.50834/abstract


And just to help you out a little, the surface area of the worlds oceans is about 360 million km2
http://en.wikipedia.org/wiki/Ocean

A 7mm drop would therefore be about 2500 km3 in volume.

The Great Artesian Basin is estimated to hold some 65,000 km3 of groundwater
http://en.wikipedia.org/wiki/Great_Artesian_Basin

So - a 7mm drop in the world ocean level equates to less than 4% of the capacity of the GAB.
And there is Lake Eyre, other surface and groundwater storage...

Furthermore - the average rainfall over Australia in 2010 and 2011 was about 700mm for each year
http://www.abs.gov.au/ausstats/abs@.nsf/Lookup/by%20Subject/1301.0~2012~Main%20Features~Water~279

Averaged over Australia's 7 million km2 - that is roughly 10,000km3 volume.  4 times that needed to decrease the world's ocean level by 7mm.  Based on those very rough calcs - the researchers theory sounds reasonably plausible

So, tell us again - what exactly are you laughing at?

Title: Re: Catalyst: Taking Our Temperature
Post by Rider on Aug 24th, 2013 at 6:11pm
Fasullo and his colleagues' research is due to be published next month in the journal Geophysical Research Letters. ®

Plenty of time for it to be withdrawn..certainly won't be the first peer pal reviewed load of crap to go down this way..seems pretty common these days, but at least they get in and secure a scarey headline first.

Title: Re: Catalyst: Taking Our Temperature
Post by rabbitoh07 on Aug 24th, 2013 at 6:16pm

Rider wrote on Aug 24th, 2013 at 6:11pm:
Fasullo and his colleagues' research is due to be published next month in the journal Geophysical Research Letters. ®

Plenty of time for it to be withdrawn..certainly won't be the first peer pal reviewed load of crap to go down this way..seems pretty common these days, but at least they get in and secure a scarey headline first.

And which part of the paper is "crap"

Can you explain it to us?

Or is denial just you default setting?

Title: Re: Catalyst: Taking Our Temperature
Post by Rider on Aug 24th, 2013 at 6:33pm

rabbitoh07 wrote on Aug 24th, 2013 at 6:16pm:

Rider wrote on Aug 24th, 2013 at 6:11pm:
Fasullo and his colleagues' research is due to be published next month in the journal Geophysical Research Letters. ®

Plenty of time for it to be withdrawn..certainly won't be the first peer pal reviewed load of crap to go down this way..seems pretty common these days, but at least they get in and secure a scarey headline first.

And which part of the paper is "crap"

Can you explain it to us?

Or is denial just you default setting?


lets just wait and see if it get published, and then the rest of the world can look at it, and poke holes thru it, most likely the size needed to fit a Kenworth, and then we can see who has the right default setting, sceptical, or blind faith in gravy train suck hole tax payer funded grant thieves calling themselves climate scientists..

up there with the credibility of Lewandowsky and Cook.... ;D ;D

Title: Re: Catalyst: Taking Our Temperature
Post by rabbitoh07 on Aug 24th, 2013 at 6:54pm

Rider wrote on Aug 24th, 2013 at 6:33pm:

rabbitoh07 wrote on Aug 24th, 2013 at 6:16pm:

Rider wrote on Aug 24th, 2013 at 6:11pm:
Fasullo and his colleagues' research is due to be published next month in the journal Geophysical Research Letters. ®

Plenty of time for it to be withdrawn..certainly won't be the first peer pal reviewed load of crap to go down this way..seems pretty common these days, but at least they get in and secure a scarey headline first.

And which part of the paper is "crap"

Can you explain it to us?

Or is denial just you default setting?


lets just wait and see if it get published, and then the rest of the world can look at it, and poke holes thru it, most likely the size needed to fit a Kenworth, and then we can see who has the right default setting, sceptical, or blind faith in gravy train suck hole tax payer funded grant thieves calling themselves climate scientists..

up there with the credibility of Lewandowsky and Cook.... ;D ;D


This article has been accepted for publication and undergone full peer review but has not been through the copyediting, typesetting, pagination and proofreading process, which may lead to differences between this version and the Version of Record.

Yeah...right...that copyediting, typesetting, pagination and proofreading will make all the difference.

Nice try, denier.
You have nothing, do you.
Just parrotting Jonesy, as usual.

Title: Re: Catalyst: Taking Our Temperature
Post by # on Aug 24th, 2013 at 8:33pm

Ajax wrote on Aug 24th, 2013 at 3:35pm:
...
THAT WAS THE BEST LAUGH I'VE HAD IN A WHILE.
...

The intended audience is those who seek knowledge. Those who believe they know all seek nothing - and often succeed in finding it.

Title: Re: Catalyst: Taking Our Temperature
Post by Deathridesahorse on Aug 24th, 2013 at 9:08pm

# wrote on Aug 24th, 2013 at 8:33pm:

Ajax wrote on Aug 24th, 2013 at 3:35pm:
...
THAT WAS THE BEST LAUGH I'VE HAD IN A WHILE.
...

The intended audience is those who seek knowledge. Those who believe they know all seek nothing - and often succeed in finding it.

Ajax loves daddykins and that's all he needs to know!

  :D :D :D :D

Title: Re: Catalyst: Taking Our Temperature
Post by muso on Aug 24th, 2013 at 10:16pm

Ajax wrote on Aug 24th, 2013 at 3:35pm:
So......all the rain fell on Australia and not in the sea that's why oceans have dropped 7mmm.

What a whole lot of malarkey..................!!!!!!


Ajax,

You claim to be a skeptic, so just do a little calculation, ok?

Divide the surface area of Australia by the surface area of the oceans and multiply by 100 to give a percentage if you like.

I make it 2.2%

How much rainfall would it take over Australia in 2010-2011 to drop the ocean 7mm?

A simple calculation. (100 x 7)/2.2

I get about 318mm. What do you get?

318mm of rain on average over those two years would have to be locked up somewhere? Where? The aquifers (groundwater) of course. (and the surface waters , lakes, dams etc)

How much rainfall actually fell on Australia during that 2 year period ?   

Here's your link to find out:

http://www.bom.gov.au/climate/current/statements/scs38.pdf

It adds up to 1.407 metres on average across all of Australia. 

Of that total, we said 318mm of rain must have been tied up in the aquifers and surface waters. What's 318 divided by 1407 expressed as a percentage?

I make it 22%. So 22% of the rain that fell over Australia over those two seasons was accumulated.

Given that the aquifers were highly depleted for the 10 years leading up to that event, it's hardly surprising that the country soaked it up and retained it for a while.

Now instead of laughing like a jackass, do the calculation and tell me if you agree or not.  Be honest.

Title: Re: Catalyst: Taking Our Temperature
Post by progressiveslol on Aug 25th, 2013 at 12:10am
lol I agree. This is too funny.

So lets take the approach of calculating how much water Australia sponged off the giving oceans.

Now lets play the game of life and reverse that affect. Doing the reverse tells us that Australia must have given the oceans water that it had previous held, thereby rising the sea levels.

So now we know why the sea levels have risen in the past. Australia was kindly giving the oceans its water. Now it is taking it back.

Title: Re: Catalyst: Taking Our Temperature
Post by muso on Aug 25th, 2013 at 7:47am

progressiveslol wrote on Aug 25th, 2013 at 12:10am:
lol I agree. This is too funny.

So lets take the approach of calculating how much water Australia sponged off the giving oceans.

Now lets play the game of life and reverse that affect. Doing the reverse tells us that Australia must have given the oceans water that it had previous held, thereby rising the sea levels.

So now we know why the sea levels have risen in the past. Australia was kindly giving the oceans its water. Now it is taking it back.


I don't really believe that you are so incredibly thick that you can't check a simple calculation.


Can you see the  dip for the storm seasons of 2010-11, and how it recovers again afterwards?

Make sense?    ::)

Title: Re: Catalyst: Taking Our Temperature
Post by Chimp_Logic on Aug 25th, 2013 at 9:28am

muso wrote on Aug 25th, 2013 at 7:47am:

progressiveslol wrote on Aug 25th, 2013 at 12:10am:
lol I agree. This is too funny.

So lets take the approach of calculating how much water Australia sponged off the giving oceans.

Now lets play the game of life and reverse that affect. Doing the reverse tells us that Australia must have given the oceans water that it had previous held, thereby rising the sea levels.

So now we know why the sea levels have risen in the past. Australia was kindly giving the oceans its water. Now it is taking it back.


I don't really believe that you are so incredibly thick that you can't check a simple calculation.


Can you see the  dip for the storm seasons of 2010-11, and how it recovers again afterwards?

Make sense?    ::)


Excellent post muso!

I wonder if you can apply the same basic logic and intellectual rigour to the dangers of nuclear accident fallout and the health risks associated with internal exposure to radionuclidic particles?

It would be riveting reading to see how you insert the schism of applicability to both branches of science which are well supported by theory and observation/experiment.

Title: Re: Catalyst: Taking Our Temperature
Post by # on Aug 25th, 2013 at 10:13am
No response to all the information in the Catalyst video, from the Cult of Climate Science Denial. Funny that!

Title: Re: Catalyst: Taking Our Temperature
Post by Ajax on Aug 25th, 2013 at 10:22am

rabbitoh07 wrote on Aug 24th, 2013 at 5:53pm:
Sorry you interrupt your jollies - but what is it you find funny?

Australia is a very large landmass that received an extraordinary amount of rainfall in 2010/11.


Australia is the smallest continent on Earth, well then what about the monsoons over Asia and the hurricane season in the America's.

Just exactly how much do they reduce the sea levels...???

When sea level rises it is due to global warming.

But when it falls it is due to too much rain over Australia..???

What a smacking joke........?????????


Quote:
Unlike other continental landmasses - the vast majority of this rainfall did not flow back to the oceans, but flowed to inland basins


Now why is that rabbit..??? water will always find its way to the lowest point being sea level, whether its on top of the ground or underground.


Quote:
When a very large amount of water does not flow back into the ocean when it would normally flow back into the ocean - what do you think might happen to the amount of water in the ocean.


You mean to tell me that the floods we had in QLD in those two years most of the water got soaked into the ground...????

That's a phurphy if I've ever heard one, you guys get really desperate to prove the theories of the IPCC are correct don't you.

Just because the IPCC said that sea levels would rise every year and for a few years they didn't rise, now your telling us that Australia  drank all the rain water and it isn't about to give back up to the cycle that she's very much apart of.

Desperate dude.....aren't ya.....???????


Quote:
THink carefully.
THis is not a trick question.


Only the very gullible and algorians who have the faith would believe such tripe or even contemplate it.

You know rabbit you better get back in your hole cause most aussies can smell snake oil from miles away.


Quote:
Here is the peer-rewieved paper the article was referring to:

Why don't you explain to us what the researcher got wrong.
Could you do that?

http://onlinelibrary.wiley.com/doi/10.1002/grl.50834/abstract


Peer reviewed by who.........??????

Other alarmist scientists on the AGW gravy train...???


Quote:
And just to help you out a little, the surface area of the worlds oceans is about 360 million km2
http://en.wikipedia.org/wiki/Ocean

A 7mm drop would therefore be about 2500 km3 in volume.

The Great Artesian Basin is estimated to hold some 65,000 km3 of groundwater
http://en.wikipedia.org/wiki/Great_Artesian_Basin

So - a 7mm drop in the world ocean level equates to less than 4% of the capacity of the GAB.
And there is Lake Eyre, other surface and groundwater storage...

Furthermore - the average rainfall over Australia in 2010 and 2011 was about 700mm for each year
http://www.abs.gov.au/ausstats/abs@.nsf/Lookup/by%20Subject/1301.0~2012~Main%20Features~Water~279

Averaged over Australia's 7 million km2 - that is roughly 10,000km3 volume.  4 times that needed to decrease the world's ocean level by 7mm.  Based on those very rough calcs - the researchers theory sounds reasonably plausible

So, tell us again - what exactly are you laughing at?


I haven't checked your calcs and i'm not going to....!!!!!

LMFAO...............?????????????????????????

Are you suggesting that a column with a base of 2500km squared and a height of 2500 km just mysteriously sunk into the Australian terrain.

Rabbit get back in your hole and don't be so stupid.

Title: Re: Catalyst: Taking Our Temperature
Post by rabbitoh07 on Aug 25th, 2013 at 10:29am

Ajax wrote on Aug 25th, 2013 at 10:22am:
I haven't checked your calcs and i'm not going to....!!!!!

LMFAO...............?????????????????????????

Are you suggesting that a column with a base of 2500km squared and a height of 2500 km just mysteriously sunk into the Australian terrain.

Dude get back in your hole and don't be so stupid.

No - I am not suggesting that a  a column with a base of 2500km squared and a height of 2500 km just mysteriously sunk into the Australian terrain.  I said nothing of the sort.

Why don't you show us some of the "scepticism" you claim to have - instead of blind denial?

You don't want to check my calculations?  Fine - check Muso's then

2 of us independently did basic calculations around the magnitude of volumes involved and came to exactly the same conclusions that the the amount of rain that fell over Aus in 2010/11 and the amount of potential storage on Aus could easily account for a 7mm drop in the world's ocean level.

But want to blindly deny it.

Enjoy your ignorance.

Title: Re: Catalyst: Taking Our Temperature
Post by rabbitoh07 on Aug 25th, 2013 at 10:36am

Ajax wrote on Aug 25th, 2013 at 10:22am:
Only the very gullible and algorians who have the faith would believe such tripe or even contemplate it.

Don't you claim to be a "sceptic"?

I was sceptical of the claim in the article.  It sounded extraordinary.  So I did some calculations to see it could possibly be true.  Turns out, after my calculations - that it is entirely within the realms of possibilty that it may be true.

Muso, it appears, did exactly the same thing.

That is what "scepticism" is.

Not blind denial - as you are doing.  Refusing to "even contemplate" something which does not fit your belief system. 

That is denial.
That is ignorance.

Title: Re: Catalyst: Taking Our Temperature
Post by Ajax on Aug 25th, 2013 at 10:37am

rabbitoh07 wrote on Aug 25th, 2013 at 10:29am:

Ajax wrote on Aug 25th, 2013 at 10:22am:
I haven't checked your calcs and i'm not going to....!!!!!

LMFAO...............?????????????????????????

Are you suggesting that a column with a base of 2500km squared and a height of 2500 km just mysteriously sunk into the Australian terrain.

Dude get back in your hole and don't be so stupid.

No - I am not suggesting that a  a column with a base of 2500km squared and a height of 2500 km just mysteriously sunk into the Australian terrain.  I said nothing of the sort.

Why don't you show us some of the "scepticism" you claim to have - instead of blind denial?

You don't want to check my calculations?  Fine - check Muso's then

2 of us independently did basic calculations around the magnitude of volumes involved and came to exactly the same conclusions that the the amount of rain that fell over Aus in 2010/11 and the amount of potential storage on Aus could easily account for a 7mm drop in the world's ocean level.

But want to blindly deny it.

Enjoy your ignorance.


Like I said they will not allow IPCC predictions to be proven wrong.

Every time they have been proven wrong, they muster up some excuse, sometimes it may be feasible but most times its absolutely outrageous, this is one of those.

Dude didn't you work out that a 7mm reduction in the oceans would equate to 2500 cubic kilometres of water????

That's how much the Australian terrain would've had to drink to lower sea levels by 7mm.

I'll leave it to the reader to decide such an outrageous hypothesis.....!!!???

Do you think we're stupid or something....???????

Title: Re: Catalyst: Taking Our Temperature
Post by muso on Aug 25th, 2013 at 10:38am

Ajax wrote on Aug 25th, 2013 at 10:22am:
You mean to tell me that the floods we had in QLD in those two years most of the water got soaked into the ground...????


1. It was a bit more extensive than Queensland, and
2. No, only about 22 % of it was retained for a short period. (Look at the chart I posted and read my posts. )

Title: Re: Catalyst: Taking Our Temperature
Post by Ajax on Aug 25th, 2013 at 10:40am

muso wrote on Aug 25th, 2013 at 10:38am:

Ajax wrote on Aug 25th, 2013 at 10:22am:
You mean to tell me that the floods we had in QLD in those two years most of the water got soaked into the ground...????


1. It was a bit more extensive than Queensland, and
2. No, only about 22 % of it was retained for a short period. (Look at the chart I posted and read my posts. )


So then how did the rainfall over Australia in those two years equate to the 7mm drop in sea level....??????

Title: Re: Catalyst: Taking Our Temperature
Post by muso on Aug 25th, 2013 at 10:41am

Chimp_Logic wrote on Aug 25th, 2013 at 9:28am:
Excellent post muso!

I wonder if you can apply the same basic logic and intellectual rigour to the dangers of nuclear accident fallout and the health risks associated with internal exposure to radionuclidic particles?

It would be riveting reading to see how you insert the schism of applicability to both branches of science which are well supported by theory and observation/experiment.


Thanks Chimp. Let's keep this thread on topic. If you want to start a discussion on the effects of Fukushima, please start a new thread.

Title: Re: Catalyst: Taking Our Temperature
Post by rabbitoh07 on Aug 25th, 2013 at 10:43am

Ajax wrote on Aug 25th, 2013 at 10:37am:
Like I said they will not allow IPCC predictions to be proven wrong.

Every time they have been proven wrong, they muster up some excuse, sometimes it may be feasible but most times its absolutely outrageous, this is one of those.

Dude didn't you work out that a 7mm reduction in the oceans would equate to 2500 cubic kilometres of water????

Yes.  Correct


Ajax wrote on Aug 25th, 2013 at 10:37am:
That's how much the Australian terrain would've had to drink to lower sea levels by 7mm.

Yes.  Correct.

And given that the GAB has a capacity of 65,000km3, and the amount of rain that fell over in Australia in those 2 years was about 10,000km3 - the idea that some 2500km3 of that water may have not been returned to the oceans over that 2 years seems entirely plausible.

2500km3 represents about 25% of the water that fell on Aus in those 2 years
2500km3 represents about 4% of the capacity of the GAB


Ajax wrote on Aug 25th, 2013 at 10:37am:
I'll leave it to the reader to decide such an outrageous hypothesis.....!!!???

Good idea.

My calculations versus your blind denial.


Ajax wrote on Aug 25th, 2013 at 10:37am:
Do you think we're stupid or something....???????

Do you really want me to answer that?

Title: Re: Catalyst: Taking Our Temperature
Post by Ajax on Aug 25th, 2013 at 10:49am

rabbitoh07 wrote on Aug 25th, 2013 at 10:43am:
And given that the GAB has a capacity of 65,000km3, and the amount of rain that fell over in Australia in those 2 years was about 10,000km3 - the idea that some 2500km3 of that water may have not been returned to the oceans over that 2 years seems entirely plausible.


Pull the other one dude....????

Back to the drawing board for you my friend....????

Title: Re: Catalyst: Taking Our Temperature
Post by muso on Aug 25th, 2013 at 10:54am
Ajax,

Read my reply #14.
If you don't believe the Australian Bureau of Meteorology official figures, then there is no hope for you.

Quote:
Are you suggesting that a column with a base of 2500km squared and a height of 2500 km just mysteriously sunk into the Australian terrain.


Multiple 2500x2500x2500. What do you get? (hint - not 2500)

Title: Re: Catalyst: Taking Our Temperature
Post by rabbitoh07 on Aug 25th, 2013 at 10:54am

Ajax wrote on Aug 25th, 2013 at 10:49am:
[And given that the GAB has a capacity of 65,000km3, and the amount of rain that fell over in Australia in those 2 years was about 10,000km3 - the idea that some 2500km3 of that water may have not been returned to the oceans over that 2 years seems entirely plausible.

Pull the other one dude....????

It is estimated that more than 65 million gigalitres (GL) of water are stored in the GAB
http://www.environment.gov.au/water/publications/watermatters/water-matters-may-2009.html#artesian


Rainfall averaged over Australia during 2011 was 705 mm, very similar to 2010 (703 mm).
http://www.abs.gov.au/ausstats/abs@.nsf/Lookup/by%20Subject/1301.0~2012~Main%20Features~Water~279


Ajax wrote on Aug 25th, 2013 at 10:49am:
Back to the drawing board for you my friend....????

Why?

Which values I have used to you consider to be incorrect?

Can you tell me?
Or are you just blindly denying every thing that does not fit your belief system?

Title: Re: Catalyst: Taking Our Temperature
Post by muso on Aug 25th, 2013 at 11:05am
I'll check Rabbitoh's figure. He said around 10,000km3 of rain fell over the two years.

The official figures say 1.409 metres over the two seasons.

So if we multiply 1.409/1000 by the surface area of Australia, we should get the result in cubic kilometres. Right?

So that's 7,692,024 square kilometres x 1.409/1000

That gives an answer of 10,838

Pretty close.


You are allowed to be wrong. You actually admitted you were wrong on another thread on another matter (and I was impressed by your honesty), so I hope you'll do the same thing here.

Title: Re: Catalyst: Taking Our Temperature
Post by Ajax on Aug 25th, 2013 at 11:12am

rabbitoh07 wrote on Aug 25th, 2013 at 10:54am:

Ajax wrote on Aug 25th, 2013 at 10:49am:
[And given that the GAB has a capacity of 65,000km3, and the amount of rain that fell over in Australia in those 2 years was about 10,000km3 - the idea that some 2500km3 of that water may have not been returned to the oceans over that 2 years seems entirely plausible.

Pull the other one dude....????

It is estimated that more than 65 million gigalitres (GL) of water are stored in the GAB
http://www.environment.gov.au/water/publications/watermatters/water-matters-may-2009.html#artesian


Rainfall averaged over Australia during 2011 was 705 mm, very similar to 2010 (703 mm).
http://www.abs.gov.au/ausstats/abs@.nsf/Lookup/by%20Subject/1301.0~2012~Main%20Features~Water~279


Ajax wrote on Aug 25th, 2013 at 10:49am:
Back to the drawing board for you my friend....????

Why?

Which values I have used to you consider to be incorrect?

Can you tell me?
Or are you just blindly denying every thing that does not fit your belief system?


There is more than 65000 kilometres cube of water stored in GAB.

Did this amount double during the floods before being sucked underground.....???????

Somehow I don't think so.

Like I said back to the drawing board for you my friend....!!!

It is estimated that more than 65 million gigalitres (GL) of water are stored in the GAB, at pressures of up to 1,300 kilopascals. The aquifers are recharged by infiltration of rainfall and leakage from streams into outcropping sandstone, mainly on the eastern margins of the Basin along the Great Dividing Range, and also along the western and south-western margins.

Title: Re: Catalyst: Taking Our Temperature
Post by muso on Aug 25th, 2013 at 11:21am
The exact volume of water in the Great Artesian Basin is irrelevant and it doesn't even form part of Rabbitoh's argument. It's not just the GAB that is concerned. There are plenty of aquifers perched above the GAB that have refilled since the floods.

This country was parched before the Wet Season of 2010, unlike the monsoon areas of Asia. 

Title: Re: Catalyst: Taking Our Temperature
Post by rabbitoh07 on Aug 25th, 2013 at 11:24am

Ajax wrote on Aug 25th, 2013 at 11:12am:

rabbitoh07 wrote on Aug 25th, 2013 at 10:54am:

Ajax wrote on Aug 25th, 2013 at 10:49am:
[And given that the GAB has a capacity of 65,000km3, and the amount of rain that fell over in Australia in those 2 years was about 10,000km3 - the idea that some 2500km3 of that water may have not been returned to the oceans over that 2 years seems entirely plausible.

Pull the other one dude....????

It is estimated that more than 65 million gigalitres (GL) of water are stored in the GAB
http://www.environment.gov.au/water/publications/watermatters/water-matters-may-2009.html#artesian


Rainfall averaged over Australia during 2011 was 705 mm, very similar to 2010 (703 mm).
http://www.abs.gov.au/ausstats/abs@.nsf/Lookup/by%20Subject/1301.0~2012~Main%20Features~Water~279


Ajax wrote on Aug 25th, 2013 at 10:49am:
Back to the drawing board for you my friend....????

Why?

Which values I have used to you consider to be incorrect?

Can you tell me?
Or are you just blindly denying every thing that does not fit your belief system?


There is more than 65000 kilometres cube of water stored in GAB.

Did this amount double during the floods before being sucked underground.....???????

Somehow I don't think so.

Like I said back to the drawing board for you my friend....!!!

It is estimated that more than 65 million gigalitres (GL) of water are stored in the GAB, at pressures of up to 1,300 kilopascals. The aquifers are recharged by infiltration of rainfall and leakage from streams into outcropping sandstone, mainly on the eastern margins of the Basin along the Great Dividing Range, and also along the western and south-western margins.

You are not making any sense.

We know that some 10,000km3 of rain fell on Aus over 2010-11

If only a quarter of this remained on land - it is enough to drop the ocean level by 7mm

And 2500km3 is not much when compared to the amount of groundwater storage available in Aus.  As you have been shown - it equates to only 4% of the potential capacity of the GAB.  And recall that in 2010-11, Aus groundwater reserves would have been very much depleted after the long El Nino drought of 2006-08

Title: Re: Catalyst: Taking Our Temperature
Post by Ajax on Aug 25th, 2013 at 12:02pm

muso wrote on Aug 25th, 2013 at 11:05am:
I'll check Rabbitoh's figure. He said around 10,000km3 of rain fell over the two years.

The official figures say 1.409 metres over the two seasons.

So if we multiply 1.409/1000 by the surface area of Australia, we should get the result in cubic kilometres. Right?

So that's 7,692,024 square kilometres x 1.409/1000

That gives an answer of 10,838

Pretty close.


You are allowed to be wrong. You actually admitted you were wrong on another thread on another matter (and I was impressed by your honesty), so I hope you'll do the same thing here.


That is bullsh!t you cannot use the whole area of Australia in your calculations.

The rainfall didn't fall over the whole of Australia at that rate, the rain fell within certain areas.

Otherwise we would have been flushed into the sea.

I will investigate and get back to you.

Title: Re: Catalyst: Taking Our Temperature
Post by Chimp_Logic on Aug 25th, 2013 at 12:03pm

muso wrote on Aug 25th, 2013 at 10:41am:

Chimp_Logic wrote on Aug 25th, 2013 at 9:28am:
Excellent post muso!

I wonder if you can apply the same basic logic and intellectual rigour to the dangers of nuclear accident fallout and the health risks associated with internal exposure to radionuclidic particles?

It would be riveting reading to see how you insert the schism of applicability to both branches of science which are well supported by theory and observation/experiment.


Thanks Chimp. Let's keep this thread on topic. If you want to start a discussion on the effects of Fukushima, please start a new thread.


That's is true muso - I am being totally off topic in my remarks

But for a person to be consistent, when they claim to adhere to basic scientific principles and adopt the scientific method, they have to be just that - CONSISTENT, and not abandon these basic principles when it suits their personal bias or subjective views.

I am sure you would agree with that simple axiom.

Title: Re: Catalyst: Taking Our Temperature
Post by rabbitoh07 on Aug 25th, 2013 at 12:26pm

Ajax wrote on Aug 25th, 2013 at 12:02pm:

muso wrote on Aug 25th, 2013 at 11:05am:
I'll check Rabbitoh's figure. He said around 10,000km3 of rain fell over the two years.

The official figures say 1.409 metres over the two seasons.

So if we multiply 1.409/1000 by the surface area of Australia, we should get the result in cubic kilometres. Right?

So that's 7,692,024 square kilometres x 1.409/1000

That gives an answer of 10,838

Pretty close.


You are allowed to be wrong. You actually admitted you were wrong on another thread on another matter (and I was impressed by your honesty), so I hope you'll do the same thing here.


That is bullsh!t you cannot use the whole area of Australia in your calculations.

The rainfall didn't fall over the whole of Australia at that rate, the rain fell within certain areas.

Otherwise we would have been flushed into the sea.

I will investigate and get back to you.


Average annual rainfall varies considerably across Australia. Large areas of the country have average annual rainfalls of 600–1,500 millimetres (mm), a range similar to most European and North American averages. However, about half of the continent experiences an average annual rainfall of less than 300 mm.

Rainfall averaged over Australia during 2011 was 705 mm, very similar to 2010 (703 mm).


http://www.abs.gov.au/ausstats/abs@.nsf/Lookup/by%20Subject/1301.0~2012~Main%20Features~Water~279


And where did the rain fall in 2010-11?

Pretty much everywhere execpt SW WA


http://www.environment.gov.au/soe/2011/report/atmosphere/2-1-current-state-climate.html

Title: Re: Catalyst: Taking Our Temperature
Post by Ajax on Aug 25th, 2013 at 12:42pm
Typical scare mongers as all AGW zealots are.

Average rainfall 2010 = 703mm

Average rainfall 2011 = 708mm

Australia's land area = 7,692,024 km2

Amount of water that fell on Australia in 2010

5,497,490 m3 (cubic metres)

Amount of water that fell on Australia in 2011

5,445,950 m3 (cubic metres)

Total amount of water that fell on Australia in 2010 & 2011

10,943,440m3 (cubic metres)

That's 0.010943440 km3 (cubic kilometres)

Seriously folks how can we take these scare mongers seriously.

Just think about it guys a column with a base of 10,000 klm2 and of height 10,000klm would flush us of the continent of Australia.

Rabbit & muso its back to the drawing board for both of you...???!!!!!

Title: Re: Catalyst: Taking Our Temperature
Post by muso on Aug 25th, 2013 at 1:09pm

Ajax wrote on Aug 25th, 2013 at 12:42pm:
Amount of water that fell on Australia in 2010

5,497,490 m3 (cubic metres)


I'm tempted to laugh at you, but I won't.  5500 Megalitres fell on Australia ?

Check your calculations Ajax.  You're out by a factor of 1 million.

Title: Re: Catalyst: Taking Our Temperature
Post by Ajax on Aug 25th, 2013 at 1:15pm

muso wrote on Aug 25th, 2013 at 1:09pm:

Ajax wrote on Aug 25th, 2013 at 12:42pm:
Amount of water that fell on Australia in 2010

5,497,490 m3 (cubic metres)


I'm tempted to laugh at you, but I won't.  5500 Megalitres fell on Australia ?

Check your calculations Ajax.


No sir, you check your ridiculous sums please...???

Here i'll give you a heads up.

Catchment area x average rainfall = total amount of water.

Don't get your units mixed up now...!!???... ::)


Quote:
Ajax wrote:

Amount of water that fell on Australia in 2010

5,497,490 m3 (cubic metres)

Amount of water that fell on Australia in 2011

5,445,950 m3 (cubic metres)

Total amount of water that fell on Australia in 2010 & 2011

10,943,440m3 (cubic metres)

That's 0.010943440 km3 (cubic kilometres)

Title: Re: Catalyst: Taking Our Temperature
Post by muso on Aug 25th, 2013 at 1:27pm
Let's do a quick check. If an area of 1 square kilometres is 1 kilometre deep then it's 1 cubic kilometres.

Agree?


Australia's land area = 7,692,024 km2

Let's say it was 1 metre of rainfall to make it simple.

1 metre divided by 1000 =0.001 kilometres- right?

What's 7,692,024 times 0.001 ?

Title: Re: Catalyst: Taking Our Temperature
Post by muso on Aug 25th, 2013 at 2:11pm
Look, to put it into perspective you're saying that in a year that broke all records, 5,500,000 cubic metres (5500 megalitres) was the total rainfall received over the whole of Australia.

Check the data for Warragamba Dam, which should be familiar to you.  Last week, its capacity dropped by about 5000 Megalitres. 

Title: Re: Catalyst: Taking Our Temperature
Post by rabbitoh07 on Aug 25th, 2013 at 7:05pm

Ajax wrote on Aug 25th, 2013 at 12:42pm:
Typical scare mongers as all AGW zealots are.

Average rainfall 2010 = 703mm

Average rainfall 2011 = 708mm

Australia's land area = 7,692,024 km2

Amount of water that fell on Australia in 2010

5,497,490 m3 (cubic metres)

Average rainfall 2010 = 703mm
divide by 1000 = 0.703 m
divide by 1000 again = 0.000703 km

0.000703 km x 7,692,024 km2
= 5407 km3

1km3 = 1,000,000,000 m3

so 5407km3
= 5,407,000,000,000 m3


Ajax wrote on Aug 25th, 2013 at 12:42pm:
Amount of water that fell on Australia in 2011

5,445,950 m3 (cubic metres)

You are out by a factor of a million

Remember - 1km3 DOES NOT = 1,000 m3

1km3 = 1,000,000,000 m3

This seems to be where you are going wrong

Title: Re: Catalyst: Taking Our Temperature
Post by Ajax on Aug 25th, 2013 at 10:30pm
Ok Ok I got egg on my face by 1000000.

You guys are correct in a way rabbit & muso.

Where once again you fail is that the 10000km2 of rainfall does not all get absorbed by the terrain.

If you look at estimates in the BOS they say that 90% of rainfall evaporates, 2% goes into the ground and the rest 8% is runoff.

So even though I was wrong by a million it still puts your arguement into fairy land thinking that the ground will absorb 10000km2 volume of water.

Sounds like a desperate attempt to save the IPCC embarrassment.

Title: Re: Catalyst: Taking Our Temperature
Post by rabbitoh07 on Aug 26th, 2013 at 12:10am

Ajax wrote on Aug 25th, 2013 at 10:30pm:
Ok Ok I got egg on my face by 1000000.

You guys are correct in a way rabbit & muso.

Where once again you fail is that the 10000km2 of rainfall does not all get absorbed by the terrain.

If you look at estimates in the BOS they say that 90% of rainfall evaporates, 2% goes into the ground and the rest 8% is runoff.

So even though I was wrong by a million it still puts your arguement into fairy land thinking that the ground will absorb 10000km2 volume of water.

Sounds like a desperate attempt to save the IPCC embarrassment.

Nobody has said that  the ground will absorb 10000km2 volume of water.  Or even 10000km3 volume of water. (m2 is not volume)

Back to the drawing board sonny.

And would you like to show us a reference that says "90% of rainfall evaporates, 2% goes into the ground and the rest 8% is runoff."?  Or did you just make that up?

Title: Re: Catalyst: Taking Our Temperature
Post by muso on Aug 26th, 2013 at 4:45pm

Ajax wrote on Aug 25th, 2013 at 10:30pm:
Ok Ok I got egg on my face by 1000000.

You guys are correct in a way rabbit & muso.


Kudos for admitting it. You've gone up in my estimation. 

Listen carefully - on days of rainfall, there is no effective evaporation. The atmosphere is at 100% relative humidity (near as damn it). You can check individual Weather stations if you like, but where there is precipitation, evaporation is nil or negligible. Obviously the rainfall figure is what you get. If there is evaporation, it doesn't get in the rain gauge. 

I know this because during the wet seasons of 2010 and 2011, I was in the middle of it, and I was checking our weather station data and pond levels, extremely worried about overflow into water courses and the company being fined by the Environmental regulator.

This is a subject I know very well, and I lost a lot of sleep (and  hair) on those Wet seasons. It wasn't good for the blood pressure either.   

Obviously the evaporation rate recovers on dry days, but the total pan evaporation during that wet season was something like 10% of normal evaporation. Where you get extended periods of rain, there is very little evaporation.

Title: Re: Catalyst: Taking Our Temperature
Post by Ajax on Aug 26th, 2013 at 6:10pm
Hey muso

Well thank you... when i'm wrong I admit it...

No matter which way you look at it, it would be impossible for the Australian terrain to soak up 10000km3.

Yeah sure if there is already moisture in the air the evaporation rate may decrease, not disputing that one.

Hey dude the weather cannot be controlled by humans, that's something else that's impossible.


Quote:
Key facts

• Around 89% of Australia’s total rainfall evaporates or is transpired by plants into
the atmosphere. Only around 9% runs off into streams, rivers and storages. The
remaining 2% drains below the root zone into groundwater aquifers and, from
there, into rivers.

• Exactly how much rainfall returns to the atmosphere and how much is available to
recharge soil, surface, and groundwater stores depends mainly on the amount of
energy from sunshine, and to a much lesser degree on the type of soil and
vegetation, and the management practices on the land.

• Annual crops and pastures use less water per year than perennial vegetation,
including trees, primarily because of their short growing seasons and shallower
root systems. The larger canopies of native and plantation forests add to their
higher evapotranspiration.

• About 65% of continental Australia’s runoff occurs in far northern Australia and
coastal Queensland. Only about 7% of runoff occurs in the Murray-Darling Basin
where more than 50% of Australia’s water is used.


For you rabbit
http://www.mla.com.au/files/2089f840-665f-4c3d-834a-9d66008a9009/

Title: Re: Catalyst: Taking Our Temperature
Post by muso on Aug 26th, 2013 at 6:58pm

Ajax wrote on Aug 26th, 2013 at 6:10pm:
Hey muso

Well thank you... when i'm wrong I admit it...

No matter which way you look at it, it would be impossible for the Australian terrain to soak up 10000km3.

Yeah sure if there is already moisture in the air the evaporation rate may decrease, not disputing that one.

Hey dude the weather cannot be controlled by humans, that's something else that's impossible.


Quote:
[size=12]Key facts

• Around 89% of Australia’s total rainfall evaporates or is transpired by plants into
the atmosphere. Only around 9% runs off into streams, rivers and storages.


Do you think that might just be an average figure taken over many years?  ::)

Obviously when there is extended heavy rainfall, it doesn't apply to that period because evaporation and transpiration is dramatically reduced. The percentage hold up and run-off is very dependent on rainfall intensity.

I don't think you have much of a handle on this.

[quote]No matter which way you look at it, it would be impossible for the Australian terrain to soak up 10000km3.


Not 10,000. Once again, the figure is around 22% of that. 22% of 10,800km3 - about  2500 km3. Multiply that by a million and divide that by the ocean surface area (361,000,000) km2. How many millimeters does that make?

Title: Re: Catalyst: Taking Our Temperature
Post by Ajax on Aug 28th, 2013 at 12:14am

muso wrote on Aug 25th, 2013 at 11:05am:
I'll check Rabbitoh's figure. He said around 10,000km3 of rain fell over the two years.

The official figures say 1.409 metres over the two seasons.

So if we multiply 1.409/1000 by the surface area of Australia, we should get the result in cubic kilometres. Right?

So that's 7,692,024 square kilometres x 1.409/1000

That gives an answer of 10,838

Pretty close.


You are allowed to be wrong. You actually admitted you were wrong on another thread on another matter (and I was impressed by your honesty), so I hope you'll do the same thing here.


your the mathematician....?????

Title: Re: Catalyst: Taking Our Temperature
Post by rabbitoh07 on Aug 28th, 2013 at 12:44am

Ajax wrote on Aug 26th, 2013 at 6:10pm:
Hey muso

Well thank you... when i'm wrong I admit it...

No matter which way you look at it, it would be impossible for the Australian terrain to soak up 10000km3.

Yeah sure if there is already moisture in the air the evaporation rate may decrease, not disputing that one.

Hey dude the weather cannot be controlled by humans, that's something else that's impossible.


Quote:
Key facts

• Around 89% of Australia’s total rainfall evaporates or is transpired by plants into
the atmosphere. Only around 9% runs off into streams, rivers and storages. The
remaining 2% drains below the root zone into groundwater aquifers and, from
there, into rivers.

• Exactly how much rainfall returns to the atmosphere and how much is available to
recharge soil, surface, and groundwater stores depends mainly on the amount of
energy from sunshine, and to a much lesser degree on the type of soil and
vegetation, and the management practices on the land.

• Annual crops and pastures use less water per year than perennial vegetation,
including trees, primarily because of their short growing seasons and shallower
root systems. The larger canopies of native and plantation forests add to their
higher evapotranspiration.

• About 65% of continental Australia’s runoff occurs in far northern Australia and
coastal Queensland. Only about 7% of runoff occurs in the Murray-Darling Basin
where more than 50% of Australia’s water is used.


For you rabbit
http://www.mla.com.au/files/2089f840-665f-4c3d-834a-9d66008a9009/

Nobody said the Australian terrain would soak up 10000km3.

Why do you keep lying like that?

WHat you have been told - repeatedly - is that 10000km3 fell on Australia over 2 years.
WHat you have been told - repeatedly - is that one quarter of this - 2500m3 is what would be needed to to reduce the global sea level by 7mm.
Not 10000km3
2500km3
Big difference liar.
You continually lie and misrepresent what you have been told.
Why do you feel that this dishonesty is necessary?
Is it because you realise how wrong you are?

What you are now showing us is that under normal conditions - some 11% of rainfall goes to streamflow or groundwater

Fine - I will accept that.  You would have to concede however - that in 2010, after years of drought, and in a time of very high humidity - the amount of rainfall going to stream flow and ground water was probably a bit more than 11%.  Was it 25%?  Who knows - but it is in the ballpark.  A lot better than you - who was out in his calculations by a factor of a million.

Title: Re: Catalyst: Taking Our Temperature
Post by muso on Aug 28th, 2013 at 9:18am

Ajax wrote on Aug 28th, 2013 at 12:14am:
your the mathematician....?????


It's simple arithmetic, not mathematics. Keep practising your arithmetic skills and you might get a good job one day. (Would you like fries with that? - sorry I got the change wrong.)

Title: Re: Catalyst: Taking Our Temperature
Post by Ajax on Aug 28th, 2013 at 2:33pm

rabbitoh07 wrote on Aug 28th, 2013 at 12:44am:
Nobody said the Australian terrain would soak up 10000km3.


Sorry rabbit maths isn't my forte so with all these astronomical amounts of water somewhere along the way 2500km3 became 10000km3.

So you're saying 25 % of the rains got soaked up into the terrain, instead of 9% ok i'll run with that.

But what happens to all underground water....???

It finds its way to rivers and seas.......!!!!

Again this science isn't worth the paper its printed on.


Quote:
Why do you keep lying like that?


Like said with all these huge amounts of water I got lost.


Quote:
WHat you have been told - repeatedly - is that 10000km3 fell on Australia over 2 years.


agree.


Quote:
WHat you have been told - repeatedly - is that one quarter of this - 2500m3 is what would be needed to to reduce the global sea level by 7mm.
Not 10000km3
2500km3


agree


Quote:
Big difference liar.


No just a wannabe mathematician.


Quote:
You continually lie and misrepresent what you have been told.


Who's lieing now.....??????


Quote:
Why do you feel that this dishonesty is necessary?


I don't lie I search for the truth.

And when the AGW religion tells me that human CO2 emissions are responsible for heating the Earth up, and real world data suggests otherwise....well.....!!!

Just screaming at me.....because we say so.......doesn't do it fro me...!!!


Quote:
Is it because you realise how wrong you are?


Have you ever thought that your mod might be wrong...??


Quote:
What you are now showing us is that under normal conditions - some 11% of rainfall goes to streamflow or groundwater


When you give the facts and I can understand them I say cheers bud you made your point.

Why cant you except the facts about rainfall in Australia, I mean these people know what their talking, probably studied it all their lives.


Quote:
Fine - I will accept that.  You would have to concede however - that in 2010, after years of drought, and in a time of very high humidity - the amount of rainfall going to stream flow and ground water was probably a bit more than 11%.  Was it 25%?  Who knows - but it is in the ballpark.  A lot better than you - who was out in his calculations by a factor of a million.


You may be right I don't know, but like I said before all underground water finds its way to rivers and oceans.

Still puts a gaping hole in this theory that because it rained heavy over the continent of Australia some how this is responsible for lowering the sea level by 7mm.

Title: Re: Catalyst: Taking Our Temperature
Post by muso on Aug 28th, 2013 at 10:23pm

Quote:
You may be right I don't know, but like I said before all underground water finds its way to rivers and oceans.


Yes, a lot of underground water eventually ends up in the ocean again whether from drainage or evaporation. A proportion also ends up in very deep artesian aquifers.

The graph shows a blip around 2010 -2011. It then recovers big time. That's consistent with a lot of this held up water slowly percolating back into the ocean as you said.

Good point.


Quote:
Still puts a gaping hole in this theory that because it rained heavy over the continent of Australia some how this is responsible for lowering the sea level by 7mm.


- and then it recovered by about 10mm per year. Where's the gaping hole?

Title: Re: Catalyst: Taking Our Temperature
Post by Ajax on Aug 29th, 2013 at 9:46am

muso wrote on Aug 28th, 2013 at 10:23pm:

Quote:
You may be right I don't know, but like I said before all underground water finds its way to rivers and oceans.


Yes, a lot of underground water eventually ends up in the ocean again whether from drainage or evaporation. A proportion also ends up in very deep artesian aquifers.

The graph shows a blip around 2010 -2011. It then recovers big time. That's consistent with a lot of this held up water slowly percolating back into the ocean as you said.

Good point.

[quote]Still puts a gaping hole in this theory that because it rained heavy over the continent of Australia some how this is responsible for lowering the sea level by 7mm.


- and then it recovered by about 10mm per year. Where's the gaping hole? [/quote]

Where are you getting these figures from, even the IPCC have confirmed a sea level rise of less than 2mm per year.

Don't worry folks sea levels are just doing what they've always done, there will be no Algorian tsunami as the faithful keep telling us.

IPCC estimate less than 2mm per year.
http://www.ipcc.ch/publications_and_data/ar4/wg1/en/ch5s5-5-2.html


Continental mass change from GRACE over 2002–2011 and its impact on sea level (again less than 2mm per year)
http://sealevel.colorado.edu/content/continental-mass-change-grace-over-2002%E2%80%932011-and-its-impact-sea-level

NOAA 2012 report finds sea levels rising at less than half the rate claimed by the IPCC (again less than 2mm per year)
http://hockeyschtick.blogspot.com.au/2012/12/noaa-2012-report-finds-sea-levels.html

Is There a 60-Year Oscillation in Global Mean Sea Level? (again less than 2mm per year)
http://www.agu.org/pubs/crossref/pip/2012GL052885.shtml

Title: Re: Catalyst: Taking Our Temperature
Post by muso on Aug 29th, 2013 at 3:03pm

Ajax wrote on Aug 29th, 2013 at 9:46am:
Where are you getting these figures from, even the IPCC have confirmed a sea level rise of less than 2mm per year.


Well I'm not getting the figures from Internet blogs as you are. Wake up to the fact that these people lie.

Once again, the data is from the University of Colorado Sea Level Research Unit.

Ajax - according to that graph, how much has the sea level jumped by between 2011 and 2013?


  Nerem, R. S., D. Chambers, C. Choe, and G. T. Mitchum. "Estimating Mean Sea Level Change from the TOPEX and Jason Altimeter Missions." Marine Geodesy 33, no. 1 supp 1 (2010): 435.


Quote:
Continental mass change from GRACE over 2002–2011 and its impact on sea level (again less than 2mm per year)


- and the blog makes the same mistake as you do. Can you now see why that isn't the same as Global Mean Sea Level rise?


Title: Re: Catalyst: Taking Our Temperature
Post by Ajax on Aug 29th, 2013 at 5:20pm
Hey muso when you put your faith in computer models you always stand the chance that when real world data is viewd and compared to the models.

You will be shot out of the sky...!!!

Have a good landing dude.

http://youtu.be/8EMoU8OOsBs

Title: Re: Catalyst: Taking Our Temperature
Post by Chimp_Logic on Aug 29th, 2013 at 5:50pm

Ajax wrote on Aug 29th, 2013 at 5:20pm:
Hey muso when you put your faith in computer models you always stand the chance that when real world data is viewd and compared to the models.

You will be shot out of the sky...!!!

Have a good landing dude.

http://youtu.be/8EMoU8OOsBs


You do realise that every single space exploration and space probe has been based upon simulations and modelling of where the planets or moons etc will be in the future?

When you project or interpolate forward in time, you are effectively modelling a process or natural mechanism with respect to time (and space)

this modelling can be empirically based or theoretically based (or a combination of the two)

what were you saying in public again?

Title: Re: Catalyst: Taking Our Temperature
Post by Ajax on Aug 29th, 2013 at 6:04pm

Chimp_Logic wrote on Aug 29th, 2013 at 5:50pm:
You do realise that every single space exploration and space probe has been based upon simulations and modelling of where the planets or moons etc will be in the future?

When you project or interpolate forward in time, you are effectively modelling a process or natural mechanism with respect to time (and space)

this modelling can be empirically based or theoretically based (or a combination of the two)

what were you saying in public again?


That's fair enough but when your projections don't match real world observations........................???

Not only that but other satellites tell a different story...!!

So why do alarmists chose the worst case always...??

Why cant alarmists say well this satellite data shows the worst case BUT that's BUT there is other data that contradicts this data and so on and so forth......!!!

Bang their very quick to hang out the worst case without even so much as an explanation.

Now what where you saying about presenting in public...??

http://translate.google.de/translate?hl=de&sl=auto&tl=en&u=http%3A%2F%2Fwww.science-skeptical.de%2Fblog%2Fwas-nicht-passt-wird-passend-gemacht-esa-korigiert-daten-zum-meeresspiegel%2F007386%2F

http://web.archive.org/web/20110719173639/http://sealevel.colorado.edu/

Title: Re: Catalyst: Taking Our Temperature
Post by muso on Aug 29th, 2013 at 7:44pm

Ajax wrote on Aug 29th, 2013 at 5:20pm:
Hey muso when you put your faith in computer models you always stand the chance that when real world data is viewd and compared to the models.


These are measurements Ajax. Measurements. The papers you quoted used models to determine the effects of changing continental mass on Global Sea Level.

Jason1 and 2 and Topex have satellite altimeters. If you have a boat,  you might be familiar with sonar instruments. Satellite altimeters use microwave pulses instead of sound. It's as close to an absolute measurement as you can get.


Quote:
Not only that but other satellites tell a different story...!!


OTHER satellites ?  ;D
What other satellites?  Do these satellites float in the ocean perchance? ;D

Do you have personal satellites that nobody else knows about?

This I've got to hear. 

You do know that you can drown if you wade too far into the ocean? (out of your depth)

Title: Re: Catalyst: Taking Our Temperature
Post by muso on Aug 29th, 2013 at 7:54pm

Ajax wrote on Aug 29th, 2013 at 5:20pm:
Hey muso when you put your faith in computer models you always stand the chance that when real world data is viewd and compared to the models.

You will be shot out of the sky...!!!


When you start commenting on things that are out of your depth Ajax, you'll drown. Quit while you're ahead.

Google glacial isostasy and tell me why it's relevant to the video you linked to. 

Title: Re: Catalyst: Taking Our Temperature
Post by Ajax on Aug 30th, 2013 at 11:10am

muso wrote on Aug 29th, 2013 at 7:44pm:

Ajax wrote on Aug 29th, 2013 at 5:20pm:
Hey muso when you put your faith in computer models you always stand the chance that when real world data is viewd and compared to the models.


These are measurements Ajax. Measurements. The papers you quoted used models to determine the effects of changing continental mass on Global Sea Level.

Jason1 and 2 and Topex have satellite altimeters. If you have a boat,  you might be familiar with sonar instruments. Satellite altimeters use microwave pulses instead of sound. It's as close to an absolute measurement as you can get.


Quote:
Not only that but other satellites tell a different story...!!


OTHER satellites ?  ;D
What other satellites?  Do these satellites float in the ocean perchance? ;D

Do you have personal satellites that nobody else knows about?

This I've got to hear. 

You do know that you can drown if you wade too far into the ocean? (out of your depth)


Muso that's exactly what i have come to expect from your mob, they take one paper usually the one that presents the worst case and showcase it to the world.

A fair and balanced view...........sure take that paper and flash it around but also inform the audience that there are other papers that show different outcomes.

There are also other scientists that present quite a different picture than the one your presenting.

Its like Al Gore he said that the CO2 & temperature charts fit like a hand in a glove.

But he didn't tell the audience that CO2 lags temperature by about 800 years.

Or did he tell the audience that millions of years ago we have had 20 times the amount of CO2 we have today in our atmosphere.

Things like that.....you know why doesn't he give us the whole mural.....?????

Instead he gives us hand picked individual snippets while keeping the rest concealed.

http://youtu.be/8EMoU8OOsBs

Title: Re: Catalyst: Taking Our Temperature
Post by # on Aug 30th, 2013 at 1:41pm

Ajax wrote on Aug 29th, 2013 at 6:04pm:
... when your projections don't match real world observations........................???
...

The vast majority of the best qualified disagree with you, or so it seems. Perhaps you're misinterpreting something.

Title: Re: Catalyst: Taking Our Temperature
Post by muso on Aug 30th, 2013 at 2:25pm

Ajax wrote on Aug 29th, 2013 at 6:04pm:
Not only that but other satellites tell a different story...!!


Your reply:


Quote:
Muso that's exactly what i have come to expect from your mob, they take one paper usually the one that presents the worst case and showcase it to the world.

A fair and balanced view...........sure take that paper and flash it around but also inform the audience that there are other papers that show different outcomes.

There are also other scientists that present quite a different picture than the one your presenting.


Paraphrased, what Ajax meant to say: "Sorry I lied. There are no other satellites, just a Swedish ex Geologist turned water diviner who wrote a paper co-authored by a furniture salesman.  One lonesome crank. "

That's your mate in the video. He talks highly of INQUA, but they are not too keen on him.

Quote:
Dr. Mörner currently has no formal position in INQUA, and I am distressed that he continues to represent himself in his former capacity. Further, INQUA, which is an umbrella organization for hundreds of researchers knowledgeable about past climate, does not subscribe to Mörner's position on climate change. Nearly all of these researchers agree that humans are modifying Earth's climate, a position diametrically opposed to Dr. Mörner's point of view
(John J. Clague, the then President of INQUA)

Here is further information on Mörner's "paper":

http://www.carbonbrief.org/blog/2011/12/rising-incredulity-at-the-spectator%E2%80%99s-use-of-dubious-sea-level-claims


Quote:
striking claims that jar with the generally accepted scientific view that sea levels are rising due to climate change, and that this will affect low lying countries.

As a result, Mörner's work has been subjected to close examination by other scientists working on sea level change in the Maldives, including papers from Professor Colin Woodroffe at the University of Wollongong, Professor Philip Woodworth of the Proudman Oceanographic Laboratory, and a group of Australia scientists led by Dr. John Church at the Centre for Australian Weather and Climate Research.

They all criticise Mörner's approach and conclusions - Woodworth examined Mörner's claims from "meteorological and oceanographic perspectives" and found them "implausible". Woodroffe described Mörner's claims as "questionable" pointing out his methodologies do not stand up to scrutiny, and that his conclusions lack supporting evidence. The group of Australian scientists found "no evidence for the fall in sea level at the Maldives as postulated by Mörner."

Futhermore, Mörner's claims about satellite altimetry are in error - the technique shows that sea levels rose by around 3 mm per year between 1993 and 2006.

Title: Re: Catalyst: Taking Our Temperature
Post by Ajax on Aug 30th, 2013 at 2:28pm

muso wrote on Aug 30th, 2013 at 2:25pm:

Ajax wrote on Aug 29th, 2013 at 6:04pm:
Not only that but other satellites tell a different story...!!


Your reply:


Quote:
Muso that's exactly what i have come to expect from your mob, they take one paper usually the one that presents the worst case and showcase it to the world.

A fair and balanced view...........sure take that paper and flash it around but also inform the audience that there are other papers that show different outcomes.

There are also other scientists that present quite a different picture than the one your presenting.


Paraphrased, what Ajax meant to say: "Sorry I lied. There are no other satellites, just a Swedish ex Geologist turned water diviner who wrote a paper co-authored by a furniture salesman.  One lonesome crank. "

That's your mate in the video. He talks highly of INQUA, but they are not too keen on him.
[quote]
Dr. Mörner currently has no formal position in INQUA, and I am distressed that he continues to represent himself in his former capacity. Further, INQUA, which is an umbrella organization for hundreds of researchers knowledgeable about past climate, does not subscribe to Mörner's position on climate change. Nearly all of these researchers agree that humans are modifying Earth's climate, a position diametrically opposed to Dr. Mörner's point of view
(John J. Clague, the then President of INQUA)

Here is further information on Mörner's "paper":

http://www.carbonbrief.org/blog/2011/12/rising-incredulity-at-the-spectator%E2%80%99s-use-of-dubious-sea-level-claims


Quote:
striking claims that jar with the generally accepted scientific view that sea levels are rising due to climate change, and that this will affect low lying countries.

As a result, Mörner's work has been subjected to close examination by other scientists working on sea level change in the Maldives, including papers from Professor Colin Woodroffe at the University of Wollongong, Professor Philip Woodworth of the Proudman Oceanographic Laboratory, and a group of Australia scientists led by Dr. John Church at the Centre for Australian Weather and Climate Research.

They all criticise Mörner's approach and conclusions - Woodworth examined Mörner's claims from "meteorological and oceanographic perspectives" and found them "implausible". Woodroffe described Mörner's claims as "questionable" pointing out his methodologies do not stand up to scrutiny, and that his conclusions lack supporting evidence. The group of Australian scientists found "no evidence for the fall in sea level at the Maldives as postulated by Mörner."

Futhermore, Mörner's claims about satellite altimetry are in error - the technique shows that sea levels rose by around 3 mm per year between 1993 and 2006.
[/quote]

http://youtu.be/8EMoU8OOsBs

Title: Re: Catalyst: Taking Our Temperature
Post by muso on Aug 30th, 2013 at 3:28pm
Yes, that video shows the Swedish water diviner who calculates sea level changes by examining buried women in the Maldives.

What's your point?

Title: Re: Catalyst: Taking Our Temperature
Post by Ajax on Aug 30th, 2013 at 7:37pm

muso wrote on Aug 30th, 2013 at 3:28pm:
Yes, that video shows the Swedish water diviner who calculates sea level changes by examining buried women in the Maldives.

What's your point?


you should watch it.

Title: Re: Catalyst: Taking Our Temperature
Post by muso on Aug 30th, 2013 at 9:56pm
I did. He has lost the plot. In another few years, I guess he'll lose other bodily functions. Quite sad really.

Title: Re: Catalyst: Taking Our Temperature
Post by Ajax on Aug 31st, 2013 at 9:28am

muso wrote on Aug 30th, 2013 at 9:56pm:
I did. He has lost the plot. In another few years, I guess he'll lose other bodily functions. Quite sad really.


Why don't you criticize his work rather than character assassination.......??????/

You're a really sad lot...... :( :( :(

Title: Re: Catalyst: Taking Our Temperature
Post by muso on Aug 31st, 2013 at 9:25pm
I did previously. You didn't read it obviously.

Title: Re: Catalyst: Taking Our Temperature
Post by Ajax on Sep 1st, 2013 at 10:41am

muso wrote on Aug 31st, 2013 at 9:25pm:
I did previously. You didn't read it obviously.


muso Dr. Nils Axel Morner is a scientist who has spent the better part of his life measuring tides through tide gauges all around the world.

I think he actually wrote some laws on tides.

The raw satellite data used to measure sea levels is taken and adjusted for accuracy or whatever else they do, in other words the data is tampered with

Dr. Nils Axel Morner is on the ground taking measurements that's real world measurements.

How can you try to discredit him is beyond me but there you go.

Title: Re: Catalyst: Taking Our Temperature
Post by # on Sep 1st, 2013 at 9:18pm

Ajax wrote on Sep 1st, 2013 at 10:41am:
...
Dr. Nils Axel Morner is on the ground taking measurements that's real world measurements.
...
The bloke's barely a blip anywhere but the denyosphere. I found this on DeSmogBlog
Quote:
Nils-Axel Mörner
Credentials

    Ph.D., Geology, (1969). [1], [2]

Background

Mörner is a retired professor from the University of Stockholm where he was the head of the Paleogeophysics and Geodynamics department from 1991 to 2005. [1], [3]

Mörner claims to be an expert in "dowsing," the practice of finding water, metals, gemstones etc. through the use of a Y-shaped twig.

Mörner's attempt to prove his dowsing abilities is chronicled by James Randi, [4] the well-known myth buster, who has offered the longstanding One Million Dollar Paranormal Challenge.
So, retired (not taking measurements, "real world" or whatever other world he inhabits). More than a bit of a kook, by the sound of it. Seems to be a favourite of the Heartland Institute.

Title: Re: Catalyst: Taking Our Temperature
Post by muso on Sep 2nd, 2013 at 11:03am
For a start, he talks about glacial isostasy and eustasy as if this was somehow important for Global sea level changes. These are effects that are localised to the Northern and Southern regions and those areas that were laden with ice during the last glaciation.


So those regions with isostatic uplift will experience little or no relative sea level rise.

The other problem is that he has a lot of rhetoric, but  no data. Even his paper on the Maldives was based on anecdotal evidence.  Every other oceanographer, and even INQUA of whom he said "They are the real experts" on the video, they all say otherwise.

The question is, do you trust a retired associate Geology professor 
with no data, or would you trust the researchers who are active in the field and have data?

Maybe you should follow Morner's advice and ask the real experts in the field, that is INQUA, not the University of Colorado Sea Level Unit (what would they know?).

Did you read in a previous post what INQUA said about him?

Title: Re: Catalyst: Taking Our Temperature
Post by Ajax on Sep 2nd, 2013 at 1:45pm
He has studied sea levels all his life taking measurements all over the world.

No matter how you try to discredit him, unless you come up with something concrete your still p!ssing against the wind.

Al least he's not like Michael Mann leaving out data that doesn't suit him.

Care to tell me why Mann left out the medieval warm period in his hockey shhhtick.......???

Or why he manipulated the day or used a program that gives you a hockey stick no matter what.

And what about climategate FFS.

I would have thought after that scandal you boys would have lost your enthusiasm over all those lies.

Title: Re: Catalyst: Taking Our Temperature
Post by muso on Sep 2nd, 2013 at 8:35pm

Ajax wrote on Sep 2nd, 2013 at 1:45pm:
He has studied sea levels all his life taking measurements all over the world.


Give me a link to some of his actual data. 

Title: Re: Catalyst: Taking Our Temperature
Post by Ajax on Sep 3rd, 2013 at 5:50pm

muso wrote on Sep 2nd, 2013 at 8:35pm:

Ajax wrote on Sep 2nd, 2013 at 1:45pm:
He has studied sea levels all his life taking measurements all over the world.


Give me a link to some of his actual data. 


Sea level is not rising
Professor Nils-Axel Mörner
http://scienceandpublicpolicy.org/blog_watch/sea_level_is_not_rising.html

http://scienceandpublicpolicy.org/images/stories/papers/reprint/sea_level_not_rising.pdf

Title: Re: Catalyst: Taking Our Temperature
Post by muso on Sep 3rd, 2013 at 7:30pm
Those two files are not peer reviewed academic papers and they don't contain any datasets. 


Quote:
Dr. Nils Axel Morner is a scientist who has spent the better part of his life measuring tides through tide gauges all around the world..


In that case there must be volumes of data. Where is it?

You haven't provided any data yet to back that up. I think that the only data he "uses" is that of other workers.

Title: Re: Catalyst: Taking Our Temperature
Post by # on Sep 3rd, 2013 at 9:39pm

Ajax wrote on Sep 3rd, 2013 at 5:50pm:
...
Sea level is not rising
Professor Nils-Axel Mörner
http://scienceandpublicpolicy.org/blog_watch/sea_level_is_not_rising.html

http://scienceandpublicpolicy.org/images/stories/papers/reprint/sea_level_not_rising.pdf

Oh, dear.

Of the Science and Public Policy Institute, sourcewatch says
Quote:
The Science and Public Policy Institute (SPPI) is a global warming skeptics website and blog now run by the Center for the Study of Carbon Dioxide and Global Change, which employs SPPI President Robert Ferguson; the SPPI website has drawn heavily on papers written by Christopher Monckton.

Ties to the American Legislative Exchange Council

In August 2011, Institute President Robert Ferguson spoke on "Benefit Analysis of CO2"[1] (previously known as "Warming Up to Climate Change: The Many Benefits of Increased Atmospheric CO2"[2]) at the Energy, Environment and Agriculture Task Force meeting at the 2011 American Legislative Exchange Council (ALEC) Annual Meeting.[3] He was accompanied by Craig Idso of the Center for the Study of Carbon Dioxide and Global Change and MEP Roger Helmer, a Member of the European Parliament for the East Midlands of Great Britain who represents the Conservative Party and has used his position on the European Parliament to fight increased regulation of member states through the European Union.[3]

About ALEC
ALEC is a corporate bill mill. It is not just a lobby or a front group; it is much more powerful than that. Through ALEC, corporations hand state legislators their wishlists to benefit their bottom line. Corporations fund almost all of ALEC's operations. They pay for a seat on ALEC task forces where corporate lobbyists and special interest reps vote with elected officials to approve “model” bills. Learn more at the Center for Media and Democracy's ALECexposed.org, and check out breaking news on our PRWatch.org site.

Mission

SPPI describes itself as "a nonprofit institute of research and education dedicated to sound public policy based on sound science." It also proclaims that it is "free from affiliation to any corporation or political party, we support the advancement of sensible public policies for energy and the environment rooted in rational science and economics. Only through science and factual information, separating reality from rhetoric, can legislators develop beneficial policies without unintended consequences that might threaten the life, liberty, and prosperity of the citizenry."[4]

Playing with the big guns now, boys.

Australian Politics Forum » Powered by YaBB 2.5.2!
YaBB Forum Software © 2000-2024. All Rights Reserved.