Post by lee on Dec 30th, 2024 at 8:32pm
"The p-values falling approximately on a 45 degree line in the plot suggests a good fit with the theoretical (uniform) distribution. Such a trend represents a distinct sample distribution for a null association between the tested variables.
If p-values are mostly less than 0.05 and fall on a line with a shallow slope in the plot, there could be a real, non-random association between tested variables. Such a trend represents a distinct sample distribution for a true association between two variables.
In the absence of biases, deviations from a near-45 degree line for the p-values may also indicate departures from the uniform distribution and a real, non-random association between two variables. In the presence of biases, the p-values can resemble the shape of a hockey stick—with some small (on the blade) and some large (on the handle). Such a p-value plot is ambiguous, and it represents an unproven research claim.
...
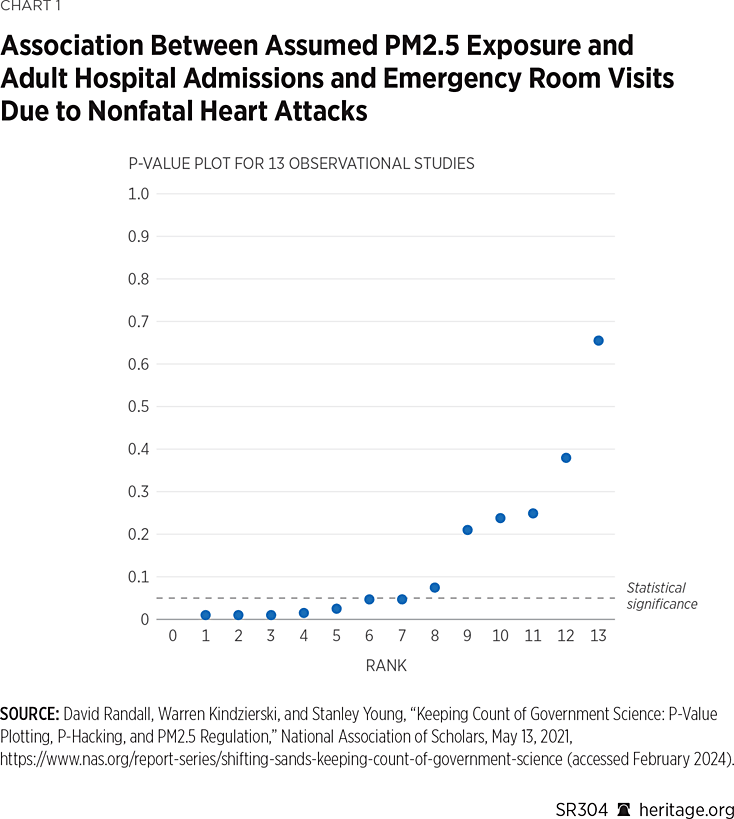
The first claim was tested on a meta-analysis of 13 observational studies that examined the association between assumed PM2.5 exposure and adult hospital admissions and emergency room visits due to nonfatal heart attacks. The meta-analysis calculated p-values from relative risks and confidence intervals. The p-values are presented in Chart 1.
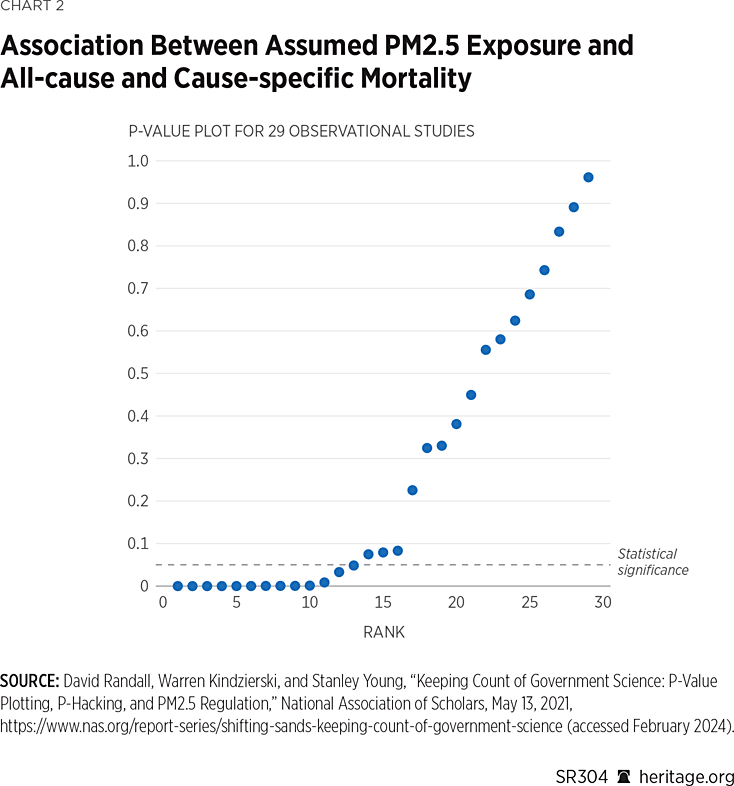
The second claim was tested on a meta-analysis of 29 observational studies that examined the association between assumed PM2.5 exposure and all-cause and cause-specific mortality. The p-values were calculated from relative risks and confidence intervals used in the meta-analysis and are presented in a p-value plot. (See Chart 2.)
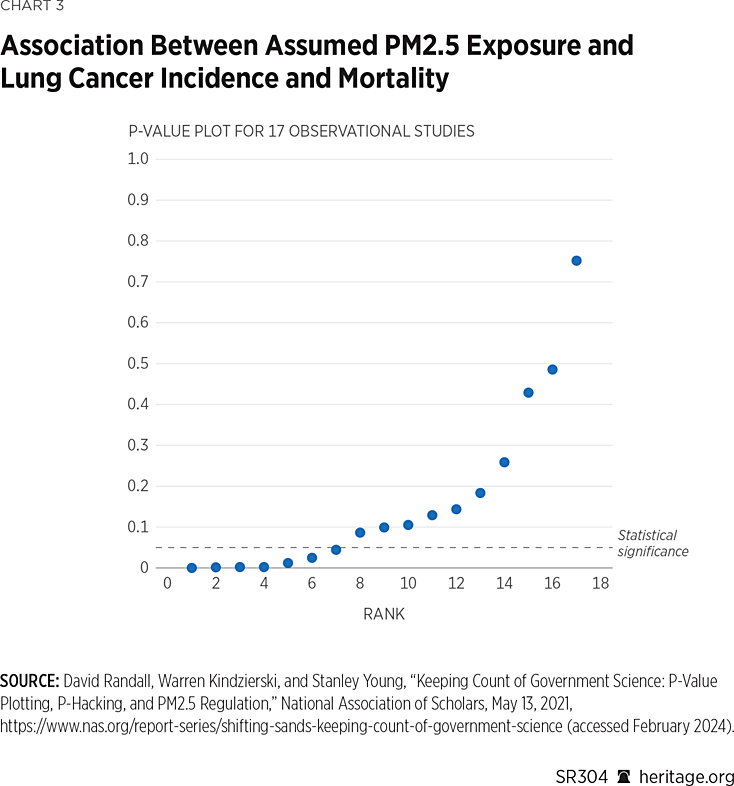
The third claim was tested on a meta-analysis of 17 observational studies that examined the association between assumed PM2.5 exposure and lung cancer incidence and mortality. The p-values were calculated from relative risks and confidence intervals used in the meta-analysis and are presented in a p-value plot. (See Chart 3.)
The p-value trends in all the charts clearly depart from the uniform distribution—p-values falling approximately on a 45 degree line. All p-value trends present as two-component mixtures. These trends do not support real exposure–disease (or death) associations. Specifically, they do not show evidence of distinct sample distributions for true effects between two variables—p-values mostly less than 0.05 and falling on a line with a shallow slope in the plot.
These trends show that the test statistics are dissimilar. Keep in mind that each of the data sets in the three charts is supposed to be addressing whether PM2.5 causes nonfatal heart attacks or premature deaths. What these charts do show is that the PM2.5 research claims cannot be reproduced.
How can such dissimilar test statistics combined in meta-analysis represent true effects? The answer is that questionable research practices and multiple testing without statistical corrections cannot be ruled out as explanations for small p-values in studies combined in a meta-analysis. It is possible and likely that false-positive results are being mistakenly claimed as true results in these studies and are being carried forward into meta-analysis.
...
Nonfatal Heart Attacks. Large, well-conducted scholarly research has reported no association of PM2.5 in outdoor air with nonfatal heart attacks. A 2009 study was conducted on nearly 400,000 emergency room visits for heart attack at 14 hospitals in seven Canadian cities during the 1990s and early 2000s.38
David M. Stieb et al., “Air Pollution and Emergency Department Visits for Cardiac and Respiratory Conditions: A Multi-City Time-Series Analysis,” Environmental Health, Vol. 8, No. 25 (2009), pp. 1–13, https://doi.org/10.1186/1476-069X-8-25 (accessed August 4, 2024).
Statistical comparisons with daily (24-hour) average levels and three-hour averages (for example, 12 a.m.–3 a.m., 3 a.m.–6 a.m., and 6 a.m.–9 a.m., and so on) for numerous air quality parameters, including PM2.5, were assessed.
The researchers found that none of the statistical comparisons for PM2.5 and heart attack emergency room visits were significant using combined data for the seven cities. This was also the case for comparisons made at the individual city level as observed by the fact that they did not present any city-level results for PM2.5−heart attack emergency room visits. Also, these researchers made no mention of the lack of an association between PM2.5 and heart attacks in their study—an example of selective reporting."
https://www.heritage.org/climate/report/air-quality-and-public-health-there-link


