Forum

 
  Back to OzPolitic.com   Welcome, Guest. Please Login or Register
  Forum Home Album HelpSearch Recent Rules LoginRegister  
 

Pages: 1 2 3 4 5 ... 13
Send Topic Print
Climate change is here — and worse than we thought (Read 33534 times)
progressiveslol
Gold Member
*****
Offline


Australian Politics

Posts: 17029
Re: Climate change is here — and worse than we thought
Reply #30 - Aug 5th, 2012 at 7:56pm
 
Going by this study, we have quite a bit of warming to go to make up from the cooling


Climate in northern Europe reconstructed for the past 2,000 years: Cooling trend calculated precisely for the first time


09.07.2012
An international team including scientists from Johannes Gutenberg University Mainz (JGU) has published a reconstruction of the climate in northern Europe over the last 2,000 years based on the information provided by tree-rings. Professor Dr. Jan Esper's group at the Institute of Geography at JGU used tree-ring density measurements from sub-fossil pine trees originating from Finnish Lapland to produce a reconstruction reaching back to 138 BC. In so doing, the researchers have been able for the first time to precisely demonstrate that the long-term trend over the past two millennia has been towards climatic cooling. "We found that previous estimates of historical temperatures during the Roman era and the Middle Ages were too low," says Esper. "Such findings are also significant with regard to climate policy, as they will influence the way today's climate changes are seen in context of historical warm periods." The new study has been published in the journal Nature Climate Change.
Was the climate during Roman and Medieval times warmer than today? And why are these earlier warm periods important when assessing the global climate changes we are experiencing today? The discipline of paleoclimatology attempts to answer such questions. Scientists analyze indirect evidence of climate variability, such as ice cores and ocean sediments, and so reconstruct the climate of the past. The annual growth rings in trees are the most important witnesses over the past 1,000 to 2,000 years as they indicate how warm and cool past climate conditions were.

Researchers from Germany, Finland, Scotland, and Switzerland examined tree-ring density profiles in trees from Finnish Lapland. In this cold environment, trees often collapse into one of the numerous lakes, where they remain well preserved for thousands of years.

The international research team used these density measurements from sub-fossil pine trees in northern Scandinavia to create a sequence reaching back to 138 BC. The density measurements correlate closely with the summer temperatures in this area on the edge of the Nordic taiga. The researchers were thus able to create a temperature reconstruction of unprecedented quality. The reconstruction provides a high-resolution representation of temperature patterns in the Roman and Medieval Warm periods, but also shows the cold phases that occurred during the Migration Period and the later Little Ice Age.

In addition to the cold and warm phases, the new climate curve also exhibits a phenomenon that was not expected in this form. For the first time, researchers have now been able to use the data derived from tree-rings to precisely calculate a much longer-term cooling trend that has been playing out over the past 2,000 years. Their findings demonstrate that this trend involves a cooling of -0.3°C per millennium due to gradual changes to the position of the sun and an increase in the distance between the Earth and the sun.

"This figure we calculated may not seem particularly significant," says Esper. "However, it is also not negligible when compared to global warming, which up to now has been less than 1°C. Our results suggest that the large-scale climate reconstruction shown by the Intergovernmental Panel on Climate Change (IPCC) likely underestimate this long-term cooling trend over the past few millennia."

...

http://www.uni-mainz.de/eng/15491.php
Back to top
« Last Edit: Aug 5th, 2012 at 8:12pm by progressiveslol »  
 
IP Logged
 
Soren
Gold Member
*****
Offline


Posts: 25654
Gender: male
Re: Climate change is here — and worse than we thought
Reply #31 - Aug 5th, 2012 at 8:02pm
 
progressiveslol wrote on Aug 5th, 2012 at 7:56pm:
Going by this study, we have quite a bit of warming to go to make up from the cooling


Climate in northern Europe reconstructed for the past 2,000 years: Cooling trend calculated precisely for the first time


09.07.2012
An international team including scientists from Johannes Gutenberg University Mainz (JGU) has published a reconstruction of the climate in northern Europe over the last 2,000 years based on the information provided by tree-rings. Professor Dr. Jan Esper's group at the Institute of Geography at JGU used tree-ring density measurements from sub-fossil pine trees originating from Finnish Lapland to produce a reconstruction reaching back to 138 BC. In so doing, the researchers have been able for the first time to precisely demonstrate that the long-term trend over the past two millennia has been towards climatic cooling. "We found that previous estimates of historical temperatures during the Roman era and the Middle Ages were too low," says Esper. "Such findings are also significant with regard to climate policy, as they will influence the way today's climate changes are seen in context of historical warm periods." The new study has been published in the journal Nature Climate Change.
Was the climate during Roman and Medieval times warmer than today? And why are these earlier warm periods important when assessing the global climate changes we are experiencing today? The discipline of paleoclimatology attempts to answer such questions. Scientists analyze indirect evidence of climate variability, such as ice cores and ocean sediments, and so reconstruct the climate of the past. The annual growth rings in trees are the most important witnesses over the past 1,000 to 2,000 years as they indicate how warm and cool past climate conditions were.

Researchers from Germany, Finland, Scotland, and Switzerland examined tree-ring density profiles in trees from Finnish Lapland. In this cold environment, trees often collapse into one of the numerous lakes, where they remain well preserved for thousands of years.

The international research team used these density measurements from sub-fossil pine trees in northern Scandinavia to create a sequence reaching back to 138 BC. The density measurements correlate closely with the summer temperatures in this area on the edge of the Nordic taiga. The researchers were thus able to create a temperature reconstruction of unprecedented quality. The reconstruction provides a high-resolution representation of temperature patterns in the Roman and Medieval Warm periods, but also shows the cold phases that occurred during the Migration Period and the later Little Ice Age.

In addition to the cold and warm phases, the new climate curve also exhibits a phenomenon that was not expected in this form. For the first time, researchers have now been able to use the data derived from tree-rings to precisely calculate a much longer-term cooling trend that has been playing out over the past 2,000 years. Their findings demonstrate that this trend involves a cooling of -0.3°C per millennium due to gradual changes to the position of the sun and an increase in the distance between the Earth and the sun.

"This figure we calculated may not seem particularly significant," says Esper. "However, it is also not negligible when compared to global warming, which up to now has been less than 1°C. Our results suggest that the large-scale climate reconstruction shown by the Intergovernmental Panel on Climate Change (IPCC) likely underestimate this long-term cooling trend over the past few millennia."

http://www.uni-mainz.de/eng/bilder_presse/09_geo_tree_ring_northern_europe_clima...

http://www.uni-mainz.de/eng/15491.php


F*ckety-f*ck, I hear you exclaim, AGW partisans.

Grin
Back to top
 
 
IP Logged
 
progressiveslol
Gold Member
*****
Offline


Australian Politics

Posts: 17029
Re: Climate change is here — and worse than we thought
Reply #32 - Aug 5th, 2012 at 8:15pm
 
Orbital forcing of tree-ring data


Same as above, paper in nature.
...

http://www.nature.com/nclimate/journal/vaop/ncurrent/full/nclimate1589.html
Back to top
 
 
IP Logged
 
Upton Sinclair
Senior Member
****
Offline


Australian Politics

Posts: 496
Re: Climate change is here — and worse than we thought
Reply #33 - Aug 6th, 2012 at 8:16pm
 
So you're showing me a graph that shows that since humans began emitting large amounts of CO2 we've managed to overcome natural forces and reverse a long term orbital cooling? Is that what you're saying? And you think this advances your cause HOW exactly? ...
Back to top
 

"I am not asking the Australian people to take me on trust, but on the record of a lifetime,"
--Tony Abbott
 
IP Logged
 
Upton Sinclair
Senior Member
****
Offline


Australian Politics

Posts: 496
Re: Climate change is here — and worse than we thought
Reply #34 - Aug 6th, 2012 at 8:22pm
 
I know that the ragingly political science deniers like progressiveslol and Soren won't bother watching it, for anyone else curious about the above graphs and what they really mean you could do worse to take 20 minutes out of your busy schedule and hear what Peter Hadfield, one time correspondent to New Scientist, has to say about the topic:

Back to top
 

"I am not asking the Australian people to take me on trust, but on the record of a lifetime,"
--Tony Abbott
 
IP Logged
 
progressiveslol
Gold Member
*****
Offline


Australian Politics

Posts: 17029
Re: Climate change is here — and worse than we thought
Reply #35 - Aug 8th, 2012 at 7:59am
 
More reason to ignore the 1930's or really more reason to ignore the political scientist hansen.

US drought index 1896 - 2012
...

http://www.ncdc.noaa.gov/temp-and-precip/time-series/index.php?parameter=pmdi&mo...
Back to top
 
 
IP Logged
 
BatteriesNotIncluded
Gold Member
*****
Offline


MediocrityNET: because
people died for this!

Posts: 26966
Re: Climate change is here — and worse than we thought
Reply #36 - Aug 8th, 2012 at 5:06pm
 
Move along: NOTHING TO SEE HERE!
  Roll Eyes Roll Eyes Roll Eyes Roll Eyes Roll Eyes

...
Back to top
 

*Sure....they're anti competitive as any subsidised job is.  It wouldn't be there without the tax payer.  Very damned difficult for a brainwashed collectivist to understand that I know....  (swaggy) *
 
IP Logged
 
Upton Sinclair
Senior Member
****
Offline


Australian Politics

Posts: 496
Re: Climate change is here — and worse than we thought
Reply #37 - Aug 8th, 2012 at 7:03pm
 
progressiveslol wrote on Aug 8th, 2012 at 7:59am:
More reason to ignore the 1930's or really more reason to ignore the political scientist hansen.

US drought index 1896 - 2012

http://www.ncdc.noaa.gov/temp-and-precip/time-series/index.php?parameter=pmdi&mo...


You see progs, I like to think of myself as a sceptically minded kind of guy and I was curious to see your graph and it's apparent stark contradiction of some of the claims made here in this very forum and decided that I needed to investigate it further. I followed your link and checked how it had been plotted and the data it represented and it all seemed above board, I even did a crash course on the Palmer Drought Index (thanks for that by the way, I had never come across that particular metric and it made for interesting reading, and I note with amusement you quoting an algorithmic MODEL of a complex interrelated and dynamic system as evidence. Was certainly good for a chuckle, I appreciate a man with a real sense of irony Grin) and everything seemed all correct and in order.

Then the penny dropped.

Your blogger of choice, Steve Goddard, had selected data for the ENTIRE contiguous US landmass, when in fact the drought is occurring predominantly over the Midwest, with some parts of the US experiencing wetter than normal conditions (like in the North West and North East):

...

So I thought it was instructive to compare the same data for particular drought effected states. Here's just one example for now::
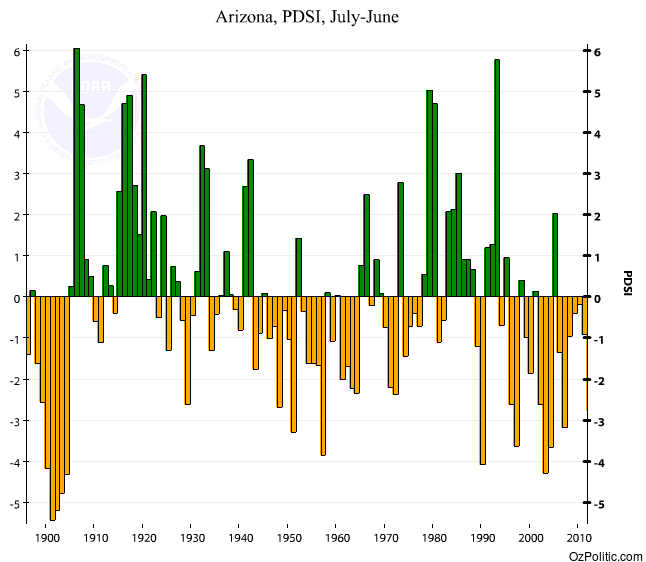
...

Annoyingly, the NCDC server stopped responding and I couldn't plot the series for Colorado and Wyoming for some more comparison but I suspect it will follow this trend.

Basically, it is safe to say that all progs's graph really shows is that there were bad droughts in the 1930's but they were more consistent, what is interesting is the way that this time around the contiguous US landmass is experiencing both record drought AND precipitation conditions at the same time. That is an entirely unique phenomenon and just more evidence of that the changing climate is causing erratic extreme weather. But, as interesting as those observations are, they speak nothing to the severity and unprecedented nature of the drought being experienced in the drought affected region itself.

I'll post a few more examples just as soon as I can connect to the NCDC tool again. I think Colorado and Wyoming should really confirm the point I am making.

I'm on 3G so I suspect that explains my difficulties getting the other states, if anyone else out there wanted to plot them and share the results with us then by all means feel free Wink
Back to top
« Last Edit: Aug 8th, 2012 at 7:14pm by Upton Sinclair »  

"I am not asking the Australian people to take me on trust, but on the record of a lifetime,"
--Tony Abbott
 
IP Logged
 
progressiveslol
Gold Member
*****
Offline


Australian Politics

Posts: 17029
Re: Climate change is here — and worse than we thought
Reply #38 - Aug 8th, 2012 at 8:13pm
 
It was good while it lasted mr hansom, but from now on, lets not expect people to take you seriously.

Study cherry picks more of Earth Is Hotter and Says Global Warming Is at Work


Martin P. Hoerling, a researcher with the National Oceanic and Atmospheric Administration who studies the causes of weather extremes, said he shared Dr. Hansen’s general concern about global warming. But he has in the past criticized Dr. Hansen for, in his view, exaggerating the connection between global warming and specific weather extremes. In an interview, he said he felt that Dr. Hansen had done so again.

Dr. Hoerling has published research suggesting that the 2010 Russian heat wave was largely a consequence of natural climate variability, and a forthcoming study he carried out on the Texas drought of 2011 also says natural factors were the main cause.

Dr. Hoerling contended that Dr. Hansen’s new paper confuses drought, caused primarily by a lack of rainfall, with heat waves.

“This isn’t a serious science paper,” Dr. Hoerling said. “It’s mainly about perception, as indicated by the paper’s title. Perception is not a science.”


http://www.nytimes.com/2012/08/07/science/earth/extreme-heat-is-covering-more-of...

Cartoon mirror. The Homer Simpson of political pseudo climate science. Doh!
...
Back to top
« Last Edit: Aug 8th, 2012 at 9:48pm by progressiveslol »  
 
IP Logged
 
Upton Sinclair
Senior Member
****
Offline


Australian Politics

Posts: 496
Re: Climate change is here — and worse than we thought
Reply #39 - Aug 9th, 2012 at 7:36pm
 
Meanwhile...

http://www.ncdc.noaa.gov/sotc/

July’s average temperature was the hottest on record for the contiguous United States, according to the National Oceanic Atmospheric Administration. The last 12 months have been the hottest ever for the U.S., with over 27,000 high temperature records broken or tied so far this year. The hot weather has only worsened dry conditions, as nearly two-thirds of the U.S. faces a drought. NASA scientist James Hansen recently connected the extreme heat to climate change, writing “there is virtually no explanation other than climate change.”

...

Average temperature in July 2012 vs. average from 1981-2010.
Back to top
 

"I am not asking the Australian people to take me on trust, but on the record of a lifetime,"
--Tony Abbott
 
IP Logged
 
progressiveslol
Gold Member
*****
Offline


Australian Politics

Posts: 17029
Re: Climate change is here — and worse than we thought
Reply #40 - Aug 9th, 2012 at 8:40pm
 
Upton Sinclair wrote on Aug 9th, 2012 at 7:36pm:
Meanwhile...

http://www.ncdc.noaa.gov/sotc/

July’s average temperature was the hottest on record for the contiguous United States, according to the National Oceanic Atmospheric Administration. The last 12 months have been the hottest ever for the U.S., with over 27,000 high temperature records broken or tied so far this year. The hot weather has only worsened dry conditions, as nearly two-thirds of the U.S. faces a drought. NASA scientist James Hansen recently connected the extreme heat to climate change, writing “there is virtually no explanation other than climate change.”

http://thinkprogress.org/wp-content/uploads/2012/08/1.jpg

Average temperature in July 2012 vs. average from 1981-2010.

Sucked in again hey AGW'ers. Seems too easy. 1930's, where is it.
Back to top
 
 
IP Logged
 
MOTR
Gold Member
*****
Offline


Australian Politics

Posts: 6646
Re: Climate change is here — and worse than we thought
Reply #41 - Aug 9th, 2012 at 8:46pm
 
Upton Sinclair wrote on Aug 8th, 2012 at 7:03pm:
progressiveslol wrote on Aug 8th, 2012 at 7:59am:
More reason to ignore the 1930's or really more reason to ignore the political scientist hansen.

US drought index 1896 - 2012

http://www.ncdc.noaa.gov/temp-and-precip/time-series/index.php?parameter=pmdi&mo...


You see progs, I like to think of myself as a sceptically minded kind of guy and I was curious to see your graph and it's apparent stark contradiction of some of the claims made here in this very forum and decided that I needed to investigate it further. I followed your link and checked how it had been plotted and the data it represented and it all seemed above board, I even did a crash course on the Palmer Drought Index (thanks for that by the way, I had never come across that particular metric and it made for interesting reading, and I note with amusement you quoting an algorithmic MODEL of a complex interrelated and dynamic system as evidence. Was certainly good for a chuckle, I appreciate a man with a real sense of irony Grin) and everything seemed all correct and in order.

Then the penny dropped.

Your blogger of choice, Steve Goddard, had selected data for the ENTIRE contiguous US landmass, when in fact the drought is occurring predominantly over the Midwest, with some parts of the US experiencing wetter than normal conditions (like in the North West and North East):

http://www1.ncdc.noaa.gov/pub/data/cmb/sotc/drought/2012/06/zin201206_pg.gif

So I thought it was instructive to compare the same data for particular drought effected states. Here's just one example for now::

http://www.ozpolitic.com/album/members/Upton_Sinclair/arizona.PNG

Annoyingly, the NCDC server stopped responding and I couldn't plot the series for Colorado and Wyoming for some more comparison but I suspect it will follow this trend.

Basically, it is safe to say that all progs's graph really shows is that there were bad droughts in the 1930's but they were more consistent, what is interesting is the way that this time around the contiguous US landmass is experiencing both record drought AND precipitation conditions at the same time. That is an entirely unique phenomenon and just more evidence of that the changing climate is causing erratic extreme weather. But, as interesting as those observations are, they speak nothing to the severity and unprecedented nature of the drought being experienced in the drought affected region itself.

I'll post a few more examples just as soon as I can connect to the NCDC tool again. I think Colorado and Wyoming should really confirm the point I am making.

I'm on 3G so I suspect that explains my difficulties getting the other states, if anyone else out there wanted to plot them and share the results with us then by all means feel free Wink


Thanks for the analysis, Upton. By aggregating the data across the contiguous US landmass, the severity of drought experienced in local areas is going to be hidden by the net increase in rainfall that comes with the atmosphere's increased capacity to hold water vapour.

It seems to me that the PDSI times series graph across the contiguous US reflects exactly what would be expected from an increase in atmospheric CO2.
Back to top
 

Hunt says Coalition accepts IPCC findings

"What does this mean? It means that we need to do practical things that actually reduce emissions."
 
IP Logged
 
Soren
Gold Member
*****
Offline


Posts: 25654
Gender: male
Re: Climate change is here — and worse than we thought
Reply #42 - Aug 9th, 2012 at 8:50pm
 
Climate change is driven by man-made graphs.  It's the worry you can have without ever leaving your computer. That's why the nerdy kids love it.


Back to top
« Last Edit: Aug 9th, 2012 at 9:09pm by Soren »  
 
IP Logged
 
progressiveslol
Gold Member
*****
Offline


Australian Politics

Posts: 17029
Re: Climate change is here — and worse than we thought
Reply #43 - Aug 9th, 2012 at 9:00pm
 
A good read on what is wrong with the temperature data siting

Peer-reviewed siting issues

http://www.gao.gov/new.items/d11800.pdf

And then onto what is to become, when they actually decide to start using it for reporting, the best temp siting stations around with the best data and no need for manipulation.

Using the NOAA USCRN data, the USA Average Temperature for July 2012 is: 75.5°F


1.There are no observer or transcription errors to correct.
2.There is no time of observation bias, nor need for correction of it.
3.There is no broad scale missing data, requiring filling in data from potentially bad surrounding stations. (FILNET)
4.There are no needs for bias adjustments for equipment types since all equipment is identical.
5.There are no need for urbanization adjustments, since all stations are rural and well sited.
6.There are no regular sensor errors due to air aspiration and triple redundant lab grade sensors. Any errors detected in one sensor are identified and managed by two others, ensuring quality data.
7.Due to the near perfect geospatial distribution of stations in the USA, there isn’t a need for gridding to get a national average temperature.


http://wattsupwiththat.com/2012/08/08/an-incovenient-result-july-2012-not-a-reco...

Back to top
 
 
IP Logged
 
MOTR
Gold Member
*****
Offline


Australian Politics

Posts: 6646
Re: Climate change is here — and worse than we thought
Reply #44 - Aug 9th, 2012 at 9:00pm
 
Soren wrote on Aug 9th, 2012 at 8:50pm:
Climate change is driven by man-made graphs.


Conspiracy Theorists Anonomous, is down the corridor. However, you are welcome to stay if you have something rational to contribute to this discussion.
Back to top
 

Hunt says Coalition accepts IPCC findings

"What does this mean? It means that we need to do practical things that actually reduce emissions."
 
IP Logged
 
Pages: 1 2 3 4 5 ... 13
Send Topic Print