Forum

 
  Back to OzPolitic.com   Welcome, Guest. Please Login or Register
  Forum Home Album HelpSearch Recent Rules LoginRegister  
 

Pages: 1 2 3 4 5 6 ... 14
Send Topic Print
Temperature data manipulation exposed (Read 23993 times)
Sparky
Gold Member
*****
Offline


Australian Politics

Posts: 1338
Gender: male
Re: Temperature data manipulation exposed
Reply #45 - May 7th, 2014 at 3:54pm
 
whats going to be the next doomsday prophecy/science fraud when this crap becomes a trivial pursuit question?

Back to top
 
 
IP Logged
 
gizmo_2655
Gold Member
*****
Offline


Australian Politics

Posts: 16010
South West NSW
Gender: male
Re: Temperature data manipulation exposed
Reply #46 - May 7th, 2014 at 4:03pm
 
Sparky wrote on May 7th, 2014 at 3:54pm:
whats going to be the next doomsday prophecy/science fraud when this crap becomes a trivial pursuit question?


Aren't they warming up the Zombie Apocalypse or a Dinosaur Killer Asteroid Collision??
Back to top
 

"I just get sick of people who place a label on someone else with their own definition.

It's similar to a strawman fallacy"
Bobbythebat
 
IP Logged
 
BatteriesNotIncluded
Gold Member
*****
Offline


MediocrityNET: because
people died for this!

Posts: 26966
Re: Temperature data manipulation exposed
Reply #47 - May 7th, 2014 at 4:52pm
 
gizmo_2655 wrote on May 7th, 2014 at 4:03pm:
Sparky wrote on May 7th, 2014 at 3:54pm:
whats going to be the next doomsday prophecy/science fraud when this crap becomes a trivial pursuit question?


Aren't they warming up the Zombie Apocalypse or a Dinosaur Killer Asteroid Collision??

Just ask the nearest real estate agents son or daughter...they even know climate change is happening but expect their vote, expected by daddy in return for the house whilst they were too high to compete in the workplace, will be usurped by a higher power and sanity will return to the world somehow...  Cheesy Cheesy Cheesy Cheesy : yeh, go the clever country full of methed up tryhard MIDDLE-upper-CLASS-holes!

** WE ALL KNOW I DON'T BREATHE A WORD OF A LIE INCLUDING THE ALMIGHTY ANDREI!  Shocked Shocked  Embarrassed
Back to top
 

*Sure....they're anti competitive as any subsidised job is.  It wouldn't be there without the tax payer.  Very damned difficult for a brainwashed collectivist to understand that I know....  (swaggy) *
 
IP Logged
 
Mattywisk
Gold Member
*****
Offline


Australian Politics

Posts: 1373
Gender: male
Re: Temperature data manipulation exposed
Reply #48 - May 8th, 2014 at 11:25pm
 
gizmo_2655 wrote on May 7th, 2014 at 4:03pm:
Sparky wrote on May 7th, 2014 at 3:54pm:
whats going to be the next doomsday prophecy/science fraud when this crap becomes a trivial pursuit question?


Aren't they warming up the Zombie Apocalypse or a Dinosaur Killer Asteroid Collision??


I think the latest is the Asteroid Apocalypse as we approach 18 years of no global warming.
Back to top
 
 
IP Logged
 
IQSRLOW
Gold Member
*****
Offline


OzPolitic

Posts: 1618
Re: Temperature data manipulation exposed
Reply #49 - May 9th, 2014 at 10:18am
 
An asteroid is probably what they are hoping for...

As Wils said
"What if climate change appears to be just mainly a multidecadal natural fluctuation? They'll kill us probably ..."
Back to top
 

Political Animal has little moderation. It is the forum for free speech and free thinkers to converse passionately without the threat of being banned. It is a forum for adults.
 
IP Logged
 
rabbitoh08
Gold Member
*****
Offline


Australian Politics

Posts: 1528
Gender: male
Re: Temperature data manipulation exposed
Reply #50 - May 9th, 2014 at 12:38pm
 
Mattywisk wrote on May 8th, 2014 at 11:25pm:
gizmo_2655 wrote on May 7th, 2014 at 4:03pm:
Sparky wrote on May 7th, 2014 at 3:54pm:
whats going to be the next doomsday prophecy/science fraud when this crap becomes a trivial pursuit question?


Aren't they warming up the Zombie Apocalypse or a Dinosaur Killer Asteroid Collision??


I think the latest is the Asteroid Apocalypse as we approach 18 years of no global warming.

When was there 18 years of no global warming?

The arctic continues to melt
Sea levels continue to rise
Global glacial mass balance continues to decline

Why is this happening if there has been "18 years of no global warming"?!?!

Any hints?
Back to top
 
 
IP Logged
 
rabbitoh08
Gold Member
*****
Offline


Australian Politics

Posts: 1528
Gender: male
Re: Temperature data manipulation exposed
Reply #51 - May 9th, 2014 at 12:41pm
 
progressiveslol wrote on Feb 2nd, 2014 at 6:26am:
From the 'We told you so' department


A paper out of China that quantifies many of the very problems with the US and global surface temperature record we have been discussing for years: the adjustments add more warming than the global warming signal  itself

A paper just published in Theoretical and Applied Climatology finds that the data homogenization techniques commonly used to adjust temperature records for moving stations and the urban heat island effect [UHI] can result in a “significant” exaggeration of warming trends in the homogenized record.

The effect of homogenization is clear and quite pronounced. What they found in China is based on how NOAA treats homogenization of the surface temperature record.


According to the authors:

“Our analysis shows that “data homogenization for [temperature] stations moved from downtowns to suburbs can lead to a significant overestimate of rising trends of surface air temperature.”

Basically what they are saying here is that the heat sink effect of all the concrete and asphalt surrounding the station swamps the diurnal variation of the station, and when it is moved away, the true diurnal variation returns, and then the homogenization methodology falsely adjusts the signal in a way that increases the trend.

You can see the heat sink swamping of the diurnal signal in the worst stations, Class 5, nearest urban centers in the graphs below. Compare urban, semi-urban, and rural for Class 5 stations, the effect of the larger UHI heat sink on the Tmax and Tmin is evident.


http://wattsupwiththat.com/2014/01/29/important-study-on-temperature-adjustments...

A paper about one weather station in suburban Beijing "quantifies many of the very problems with the US and global surface temperature record"?!?!  Really?!?!
Back to top
 
 
IP Logged
 
rabbitoh08
Gold Member
*****
Offline


Australian Politics

Posts: 1528
Gender: male
Re: Temperature data manipulation exposed
Reply #52 - May 9th, 2014 at 12:43pm
 
progressiveslol wrote on May 7th, 2014 at 1:38pm:
The climate reality our government is living in is little more than a self-serving construct.


Final fraud temp MINUS RAW

See where the rising temperatures are coming from. Purely coming from the pseudo climate science community, not from nature
http://wattsupwiththat.files.wordpress.com/2014/05/2014_ushcn_raw-vs-adjusted.gi...


http://wattsupwiththat.com/2014/05/06/ive-been-waiting-for-this-statement-and-th...

I see.  So the planet isn't warming after all!!!

Then why is that:

The arctic continues to melt
Sea levels continue to rise
Global glacial mass balance continues to decline

Does your nutjob conspiracy theory blog explain that?
Back to top
 
 
IP Logged
 
Rider
Gold Member
*****
Offline


Australian Politics

Posts: 2669
OnTheRoad
Gender: male
Re: Temperature data manipulation exposed
Reply #53 - May 9th, 2014 at 4:22pm
 
rabbitoh08 wrote on May 9th, 2014 at 12:41pm:
progressiveslol wrote on Feb 2nd, 2014 at 6:26am:
From the 'We told you so' department


A paper out of China that quantifies many of the very problems with the US and global surface temperature record we have been discussing for years: the adjustments add more warming than the global warming signal  itself

A paper just published in Theoretical and Applied Climatology finds that the data homogenization techniques commonly used to adjust temperature records for moving stations and the urban heat island effect [UHI] can result in a “significant” exaggeration of warming trends in the homogenized record.

The effect of homogenization is clear and quite pronounced. What they found in China is based on how NOAA treats homogenization of the surface temperature record.


According to the authors:

“Our analysis shows that “data homogenization for [temperature] stations moved from downtowns to suburbs can lead to a significant overestimate of rising trends of surface air temperature.”

Basically what they are saying here is that the heat sink effect of all the concrete and asphalt surrounding the station swamps the diurnal variation of the station, and when it is moved away, the true diurnal variation returns, and then the homogenization methodology falsely adjusts the signal in a way that increases the trend.

You can see the heat sink swamping of the diurnal signal in the worst stations, Class 5, nearest urban centers in the graphs below. Compare urban, semi-urban, and rural for Class 5 stations, the effect of the larger UHI heat sink on the Tmax and Tmin is evident.


http://wattsupwiththat.com/2014/01/29/important-study-on-temperature-adjustments...

A paper about one weather station in suburban Beijing "quantifies many of the very problems with the US and global surface temperature record"?!?!  Really?!?!


Someone's in denial.
Back to top
 
 
IP Logged
 
rabbitoh08
Gold Member
*****
Offline


Australian Politics

Posts: 1528
Gender: male
Re: Temperature data manipulation exposed
Reply #54 - May 9th, 2014 at 4:53pm
 
Rider wrote on May 9th, 2014 at 4:22pm:
rabbitoh08 wrote on May 9th, 2014 at 12:41pm:
progressiveslol wrote on Feb 2nd, 2014 at 6:26am:
From the 'We told you so' department


A paper out of China that quantifies many of the very problems with the US and global surface temperature record we have been discussing for years: the adjustments add more warming than the global warming signal  itself

A paper just published in Theoretical and Applied Climatology finds that the data homogenization techniques commonly used to adjust temperature records for moving stations and the urban heat island effect [UHI] can result in a “significant” exaggeration of warming trends in the homogenized record.

The effect of homogenization is clear and quite pronounced. What they found in China is based on how NOAA treats homogenization of the surface temperature record.


According to the authors:

“Our analysis shows that “data homogenization for [temperature] stations moved from downtowns to suburbs can lead to a significant overestimate of rising trends of surface air temperature.”

Basically what they are saying here is that the heat sink effect of all the concrete and asphalt surrounding the station swamps the diurnal variation of the station, and when it is moved away, the true diurnal variation returns, and then the homogenization methodology falsely adjusts the signal in a way that increases the trend.

You can see the heat sink swamping of the diurnal signal in the worst stations, Class 5, nearest urban centers in the graphs below. Compare urban, semi-urban, and rural for Class 5 stations, the effect of the larger UHI heat sink on the Tmax and Tmin is evident.


http://wattsupwiththat.com/2014/01/29/important-study-on-temperature-adjustments...

A paper about one weather station in suburban Beijing "quantifies many of the very problems with the US and global surface temperature record"?!?!  Really?!?!


Someone's in denial.

Shoosh you. They don't like to be called "deniers".  They think that by ignoring the vast mountains of scientific evidence and then trusting blindly some nutjobs blog about a weather station in suburban Beijing that they are being "sceptical"!
Back to top
 
 
IP Logged
 
IQSRLOW
Gold Member
*****
Offline


OzPolitic

Posts: 1618
Re: Temperature data manipulation exposed
Reply #55 - May 9th, 2014 at 5:25pm
 
Quote:
Then why is that:

The arctic continues to melt
Sea levels continue to rise
Global glacial mass balance continues to decline


The simple explanation is that you are wrong on all three counts. Perhaps you should study the science?

I don't understand why you deniers continue to ignore the science.
Back to top
 

Political Animal has little moderation. It is the forum for free speech and free thinkers to converse passionately without the threat of being banned. It is a forum for adults.
 
IP Logged
 
gizmo_2655
Gold Member
*****
Offline


Australian Politics

Posts: 16010
South West NSW
Gender: male
Re: Temperature data manipulation exposed
Reply #56 - May 9th, 2014 at 5:37pm
 
rabbitoh08 wrote on May 9th, 2014 at 4:53pm:
Rider wrote on May 9th, 2014 at 4:22pm:
rabbitoh08 wrote on May 9th, 2014 at 12:41pm:
progressiveslol wrote on Feb 2nd, 2014 at 6:26am:
From the 'We told you so' department


A paper out of China that quantifies many of the very problems with the US and global surface temperature record we have been discussing for years: the adjustments add more warming than the global warming signal  itself

A paper just published in Theoretical and Applied Climatology finds that the data homogenization techniques commonly used to adjust temperature records for moving stations and the urban heat island effect [UHI] can result in a “significant” exaggeration of warming trends in the homogenized record.

The effect of homogenization is clear and quite pronounced. What they found in China is based on how NOAA treats homogenization of the surface temperature record.


According to the authors:

“Our analysis shows that “data homogenization for [temperature] stations moved from downtowns to suburbs can lead to a significant overestimate of rising trends of surface air temperature.”

Basically what they are saying here is that the heat sink effect of all the concrete and asphalt surrounding the station swamps the diurnal variation of the station, and when it is moved away, the true diurnal variation returns, and then the homogenization methodology falsely adjusts the signal in a way that increases the trend.

You can see the heat sink swamping of the diurnal signal in the worst stations, Class 5, nearest urban centers in the graphs below. Compare urban, semi-urban, and rural for Class 5 stations, the effect of the larger UHI heat sink on the Tmax and Tmin is evident.


http://wattsupwiththat.com/2014/01/29/important-study-on-temperature-adjustments...

A paper about one weather station in suburban Beijing "quantifies many of the very problems with the US and global surface temperature record"?!?!  Really?!?!


Someone's in denial.

Shoosh you. They don't like to be called "deniers".  They think that by ignoring the vast mountains of scientific evidence and then trusting blindly some nutjobs blog about a weather station in suburban Beijing that they are being "sceptical"!


Yup YOU are in 'denial'
Back to top
 

"I just get sick of people who place a label on someone else with their own definition.

It's similar to a strawman fallacy"
Bobbythebat
 
IP Logged
 
Rider
Gold Member
*****
Offline


Australian Politics

Posts: 2669
OnTheRoad
Gender: male
Re: Temperature data manipulation exposed
Reply #57 - May 9th, 2014 at 6:37pm
 
gizmo_2655 wrote on May 9th, 2014 at 5:37pm:
rabbitoh08 wrote on May 9th, 2014 at 4:53pm:
Rider wrote on May 9th, 2014 at 4:22pm:
rabbitoh08 wrote on May 9th, 2014 at 12:41pm:
progressiveslol wrote on Feb 2nd, 2014 at 6:26am:
From the 'We told you so' department


A paper out of China that quantifies many of the very problems with the US and global surface temperature record we have been discussing for years: the adjustments add more warming than the global warming signal  itself

A paper just published in Theoretical and Applied Climatology finds that the data homogenization techniques commonly used to adjust temperature records for moving stations and the urban heat island effect [UHI] can result in a “significant” exaggeration of warming trends in the homogenized record.

The effect of homogenization is clear and quite pronounced. What they found in China is based on how NOAA treats homogenization of the surface temperature record.


According to the authors:

“Our analysis shows that “data homogenization for [temperature] stations moved from downtowns to suburbs can lead to a significant overestimate of rising trends of surface air temperature.”

Basically what they are saying here is that the heat sink effect of all the concrete and asphalt surrounding the station swamps the diurnal variation of the station, and when it is moved away, the true diurnal variation returns, and then the homogenization methodology falsely adjusts the signal in a way that increases the trend.

You can see the heat sink swamping of the diurnal signal in the worst stations, Class 5, nearest urban centers in the graphs below. Compare urban, semi-urban, and rural for Class 5 stations, the effect of the larger UHI heat sink on the Tmax and Tmin is evident.


http://wattsupwiththat.com/2014/01/29/important-study-on-temperature-adjustments...

A paper about one weather station in suburban Beijing "quantifies many of the very problems with the US and global surface temperature record"?!?!  Really?!?!


Someone's in denial.

Shoosh you. They don't like to be called "deniers".  They think that by ignoring the vast mountains of scientific evidence and then trusting blindly some nutjobs blog about a weather station in suburban Beijing that they are being "sceptical"!


Yup YOU are in 'denial'


  Wink
Back to top
 
 
IP Logged
 
rabbitoh08
Gold Member
*****
Offline


Australian Politics

Posts: 1528
Gender: male
Re: Temperature data manipulation exposed
Reply #58 - May 9th, 2014 at 6:44pm
 
IQSRLOW wrote on May 9th, 2014 at 5:25pm:
Quote:
Then why is that:

The arctic continues to melt
Sea levels continue to rise
Global glacial mass balance continues to decline


The simple explanation is that you are wrong on all three counts. Perhaps you should study the science?

I don't understand why you deniers continue to ignore the science.

I am wrong on all 3 counts am I?!?!

Really?!?!?  Are you sure?
You realise were are discussing earth?  Not whatever planet your information is beaming from?

The arctic continues to melt
Average ice extent for April 2014 was the fifth lowest for the month in the satellite record. Through 2014, the linear rate of decline for April ice extent is -2.4% per decade relative to the 1981 to 2010 average.
http://nsidc.org/arcticseaicenews/

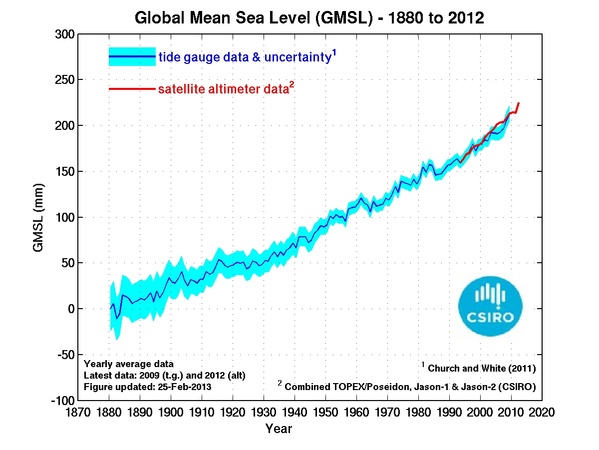
Sea levels continue to rise
...
We have used a combination of historical tide-gauge data and satellite-altimeter data to estimate global averaged sea level change from 1880 to 2009. During this period, global-averaged sea level rose about 21 cm, with an average rate of rise of about 1.6 mm/yr over the 20th Century. The sea level record indicates a statistically significant increase in the rate of rise between 1880 to 2009
http://www.cmar.csiro.au/sealevel/sl_hist_few_hundred.html

Global glacial mass balance continues to decline
Taking the two years of this reporting period together, the mean mass balance was −970 mm w.e. per year. This is more negative than the mean mass balance for the first decade of the 21st century (2000−2009: −668 mm w.e. per year) and continues the trend to more negative annual balances of the past three decades.
http://www.wgms.ch/mbb/mbb12/wgms_2013_gmbb12.pdf

So - it appears that I was exactly correct on all three counts.  Perhaps you could explain to us all what this "science" is you claim that I am denying?  The latest paper by Professor Andrew Bolt perhaps?  Dr Alan Jones?

Why did you try to tell a lie and tell me I was wrong?
Who did you think you would fool with that?

And can you explain to us why:
The arctic continues to melt
Sea levels continue to rise
Global glacial mass balance continues to decline

If - as some earlier idiot claimed, there has been "18 years of no global warming"?!?!
Back to top
 
 
IP Logged
 
rabbitoh08
Gold Member
*****
Offline


Australian Politics

Posts: 1528
Gender: male
Re: Temperature data manipulation exposed
Reply #59 - May 9th, 2014 at 6:47pm
 
gizmo_2655 wrote on May 9th, 2014 at 5:37pm:
rabbitoh08 wrote on May 9th, 2014 at 4:53pm:
Rider wrote on May 9th, 2014 at 4:22pm:
rabbitoh08 wrote on May 9th, 2014 at 12:41pm:
progressiveslol wrote on Feb 2nd, 2014 at 6:26am:
From the 'We told you so' department


A paper out of China that quantifies many of the very problems with the US and global surface temperature record we have been discussing for years: the adjustments add more warming than the global warming signal  itself

A paper just published in Theoretical and Applied Climatology finds that the data homogenization techniques commonly used to adjust temperature records for moving stations and the urban heat island effect [UHI] can result in a “significant” exaggeration of warming trends in the homogenized record.

The effect of homogenization is clear and quite pronounced. What they found in China is based on how NOAA treats homogenization of the surface temperature record.


According to the authors:

“Our analysis shows that “data homogenization for [temperature] stations moved from downtowns to suburbs can lead to a significant overestimate of rising trends of surface air temperature.”

Basically what they are saying here is that the heat sink effect of all the concrete and asphalt surrounding the station swamps the diurnal variation of the station, and when it is moved away, the true diurnal variation returns, and then the homogenization methodology falsely adjusts the signal in a way that increases the trend.

You can see the heat sink swamping of the diurnal signal in the worst stations, Class 5, nearest urban centers in the graphs below. Compare urban, semi-urban, and rural for Class 5 stations, the effect of the larger UHI heat sink on the Tmax and Tmin is evident.


http://wattsupwiththat.com/2014/01/29/important-study-on-temperature-adjustments...

A paper about one weather station in suburban Beijing "quantifies many of the very problems with the US and global surface temperature record"?!?!  Really?!?!


Someone's in denial.

Shoosh you. They don't like to be called "deniers".  They think that by ignoring the vast mountains of scientific evidence and then trusting blindly some nutjobs blog about a weather station in suburban Beijing that they are being "sceptical"!


Yup YOU are in 'denial'

Do you have anything of value to add?

Are you one of these people that think that ignoring the vast mountains of scientific evidence and then trusting blindly some nutjobs blog about a weather station in suburban Beijing that they are being "sceptical"!

Why?

Are you genuinely confused by the subject?
I would be happy to explain to you whatever it is you don't understand.
Back to top
 
 
IP Logged
 
Pages: 1 2 3 4 5 6 ... 14
Send Topic Print